This topic contains a solution. Click here to go to the answer
|
|
|

 Biological Treatments for Mental Disorders
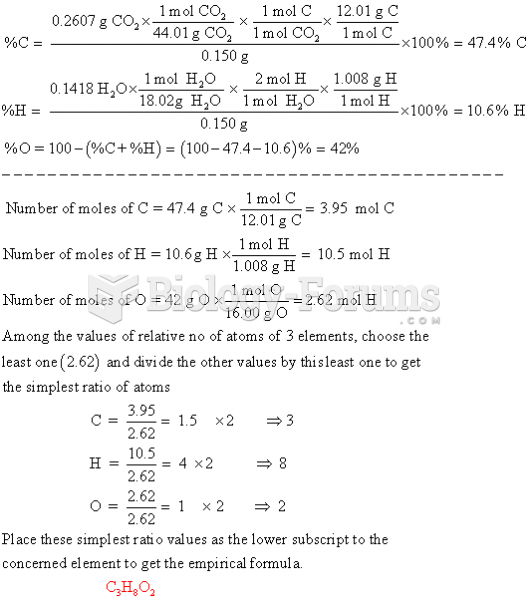 Combustion analysis of 0.150 g of an unknown compound containing carbon, hydrogen, and oxygen ...
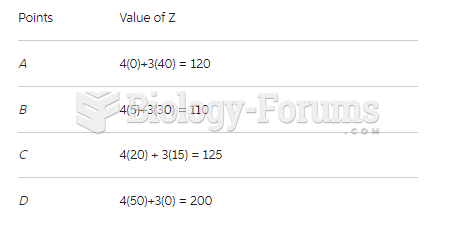 linear programming problem, applying simplex method and sensitivity analysis
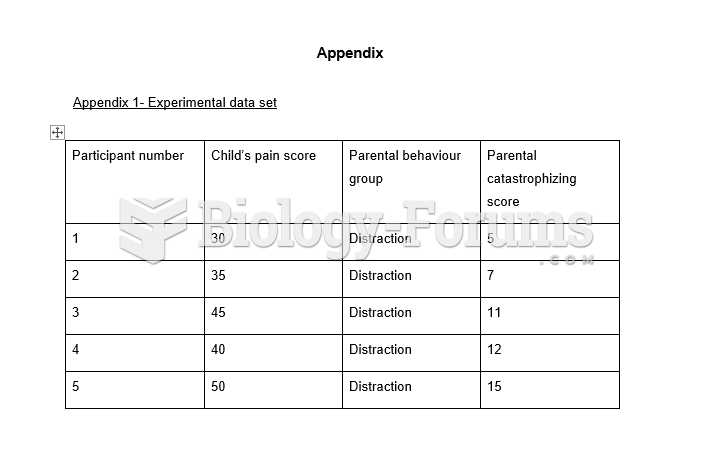 Table - Correlation Analysis
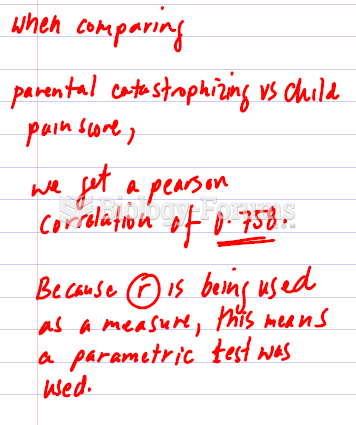 Table - Analysis
 Genetic complementation analysis