This topic contains a solution. Click here to go to the answer
|
|
|

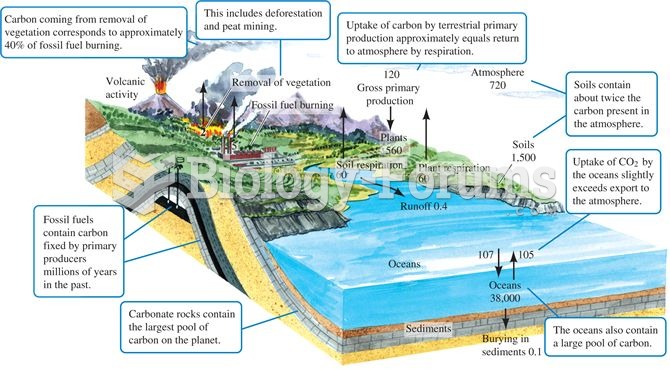 The carbon cycle. Numbers are storage as 1015 g or fluxes as 1015 g per year (data from Schlesinger
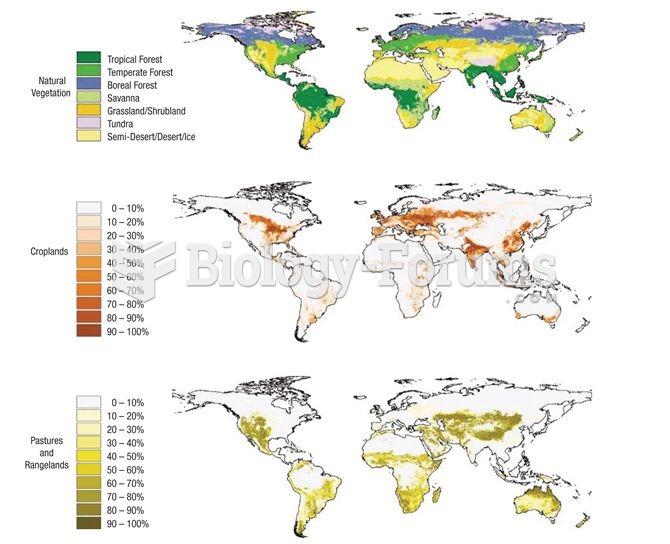 Extent of agricultural activity across the planet (data from Foley et al. 2005).
 A physician uses a portable electronic tablet to enter patient data while in the examination room.
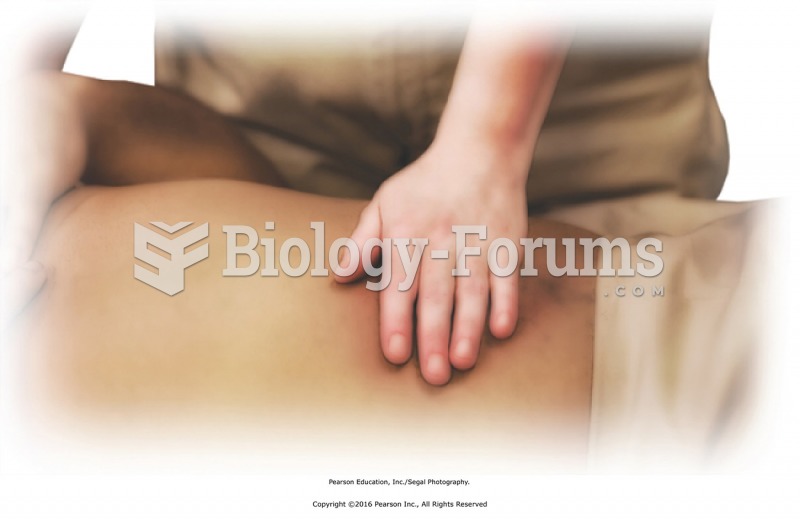 Passive touch in center of abdomen as finishing technique. Place a hand gently in the center of the ...
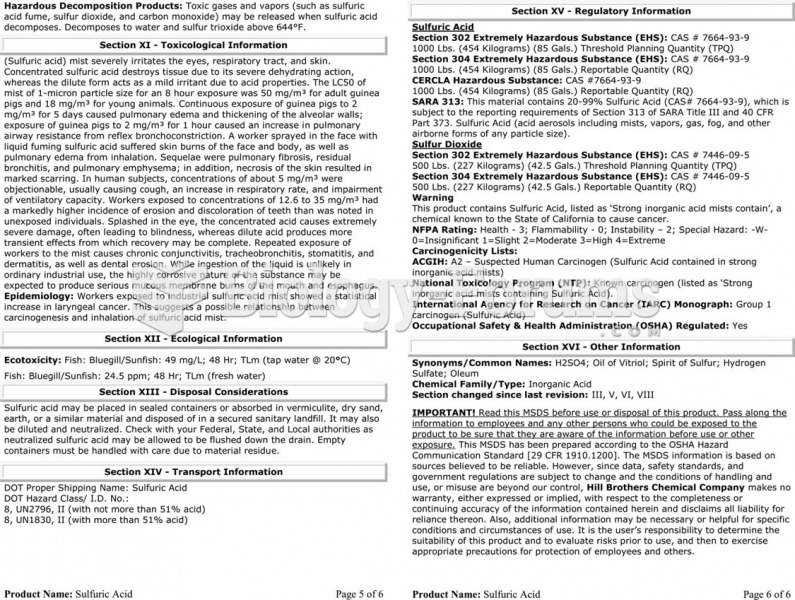 The material safety data sheet (MSDS) for sulfuric acid showing the detailed technical information ...
 Data management questions