|
|
|

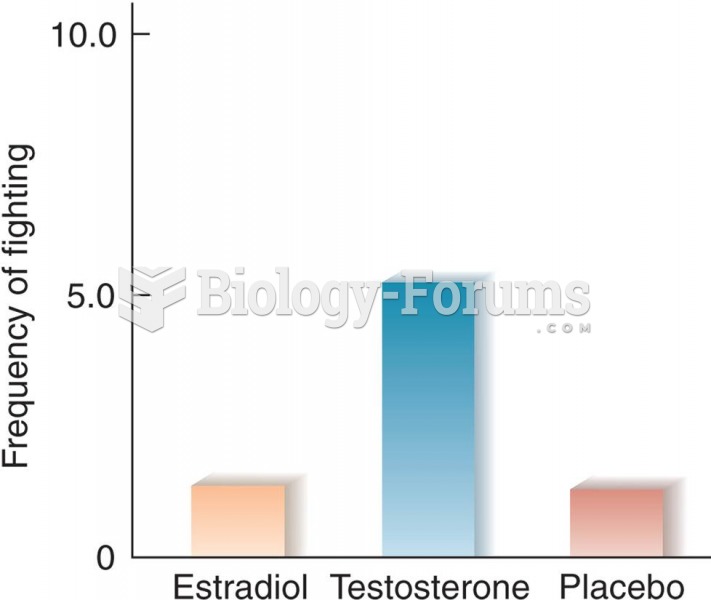 Effects of Estradiol and Testosterone on Interfemale Aggression in Rats (Based on data from van de P
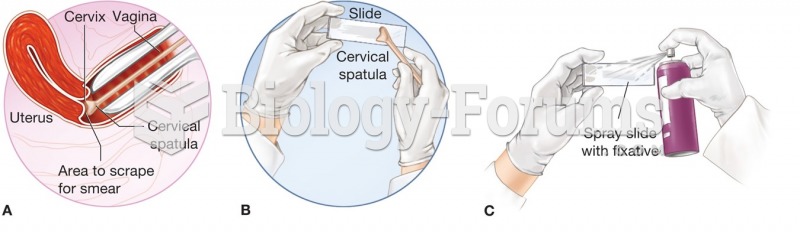 Assisting with a Pelvic Examination and Pap Test
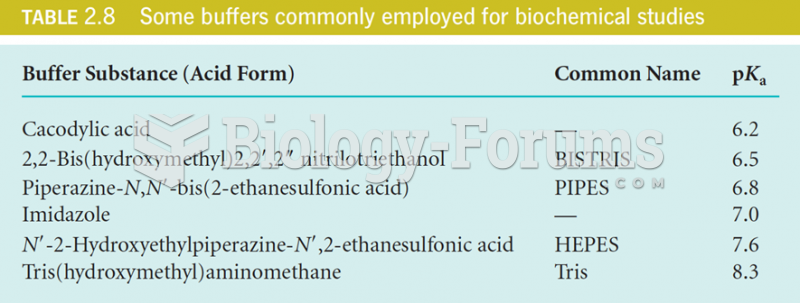 buffers commonly employed for biochemical studies
 Demographic Data for Nigeria
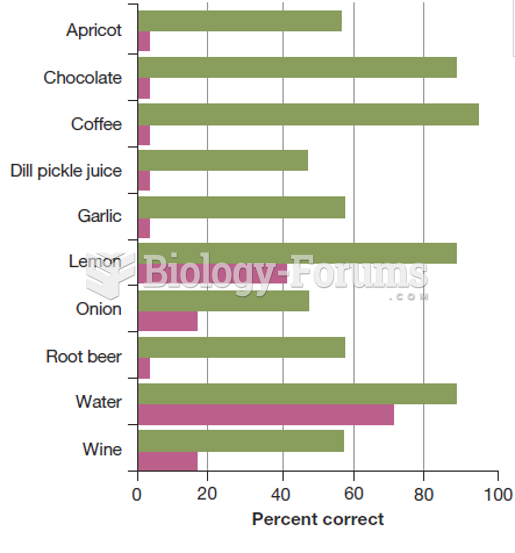 Taste Test
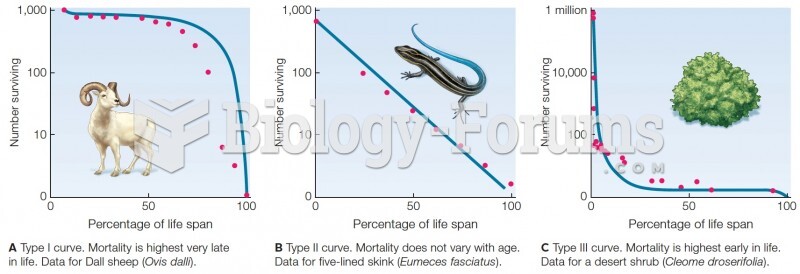 Survivorship curves. Blue lines are theoretical curves. Red dots are data from field studies.