This topic contains a solution. Click here to go to the answer
|
|
|

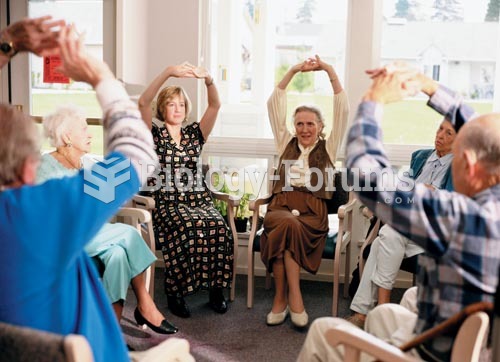 These older adults are participating in an exercise class at their assisted-living facility
 Streptococci: Individual bacteria that have a rounded shape and have clumped together to form a ...
 On average, students in Roman Catholic schools score higher on national tests than students in ...
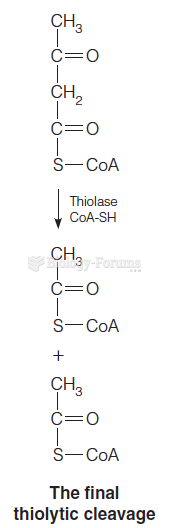 The Final Thiolytic Cleavage
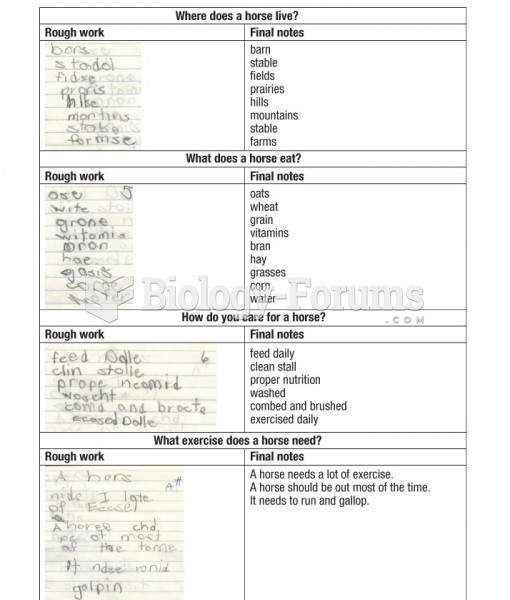 A sample of work by a Grade 4 student with a specific learning disorder
 Learning changes grade 1