This topic contains a solution. Click here to go to the answer
|
|
|

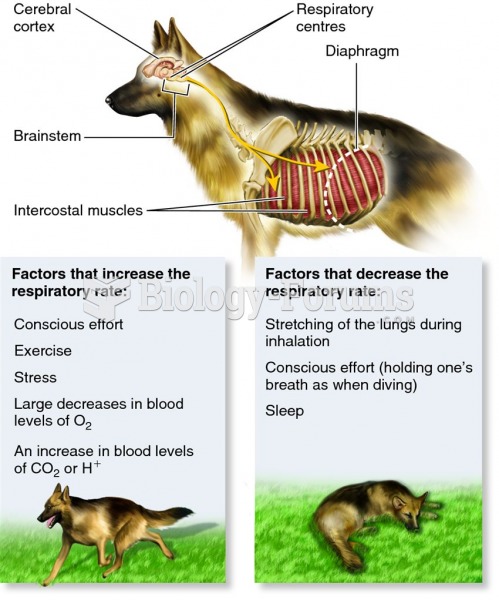 The control of breathing via respiratory centres in the mammalian brain.
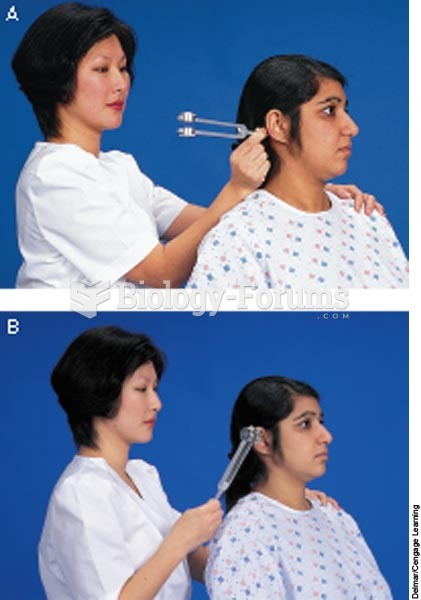 Rinne test: A. Place the base of the tuning fork on the mastoid process. B. Place tuning fork in fro
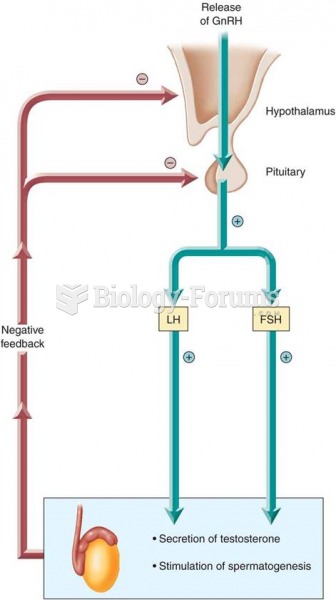 Hormonal control of the male reproductive hormones
 Nursing process as a system
 A typical accelerator pedal position (APP) sensor, showing two different output voltage signals ...
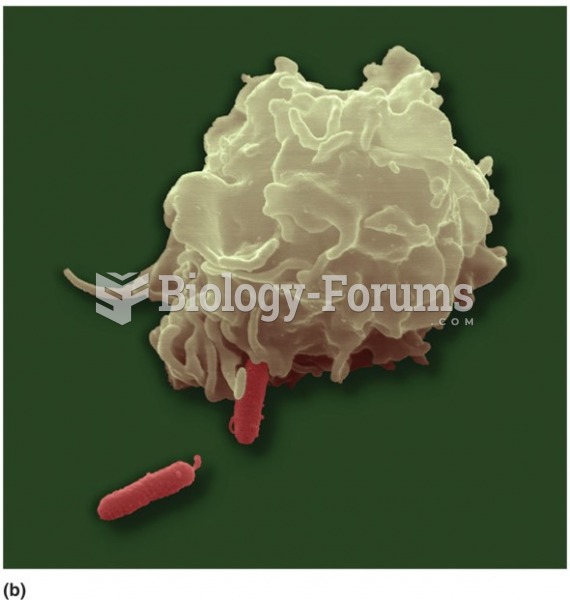 (b) Scanning electron microscopy showing a phagocytic cell in the process of phagocytizing bacteria. ...