This topic contains a solution. Click here to go to the answer
|
|
|

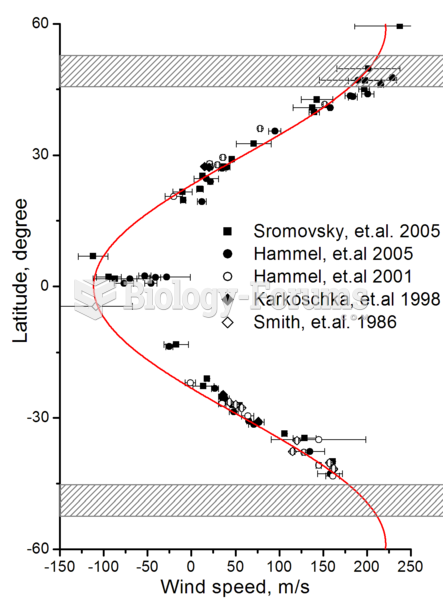 Zonal wind speeds on Uranus. Shaded areas show the southern collar and its future northern counterpa
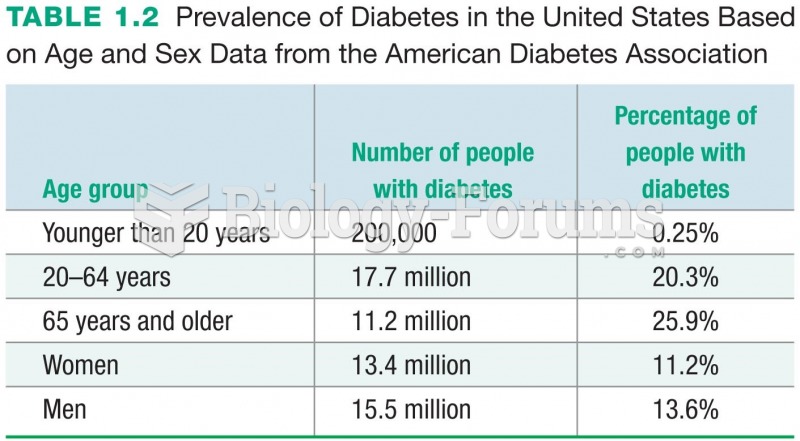 Prevalence of Diabetes in the United States Based on Age and Sex Data from the American Diabetes ...
 Apply direct thumb pressure into points along the upper trapezius from base of neck to shoulder. ...
 Cat paw mobilizing of shoulders toward the feet. Press downward along upper trapezius muscle from ...
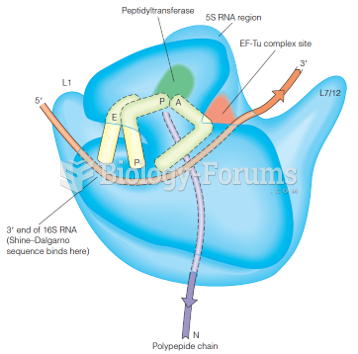 A model of the 70S ribosome based upon early structural data
 How to create a table of values displaying commission and earnings (Question 2)