This topic contains a solution. Click here to go to the answer
|
|
|

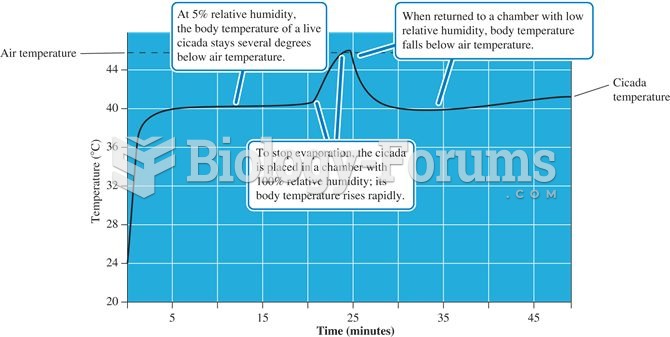 A laboratory experiment verified evaporative cooling by the cicada, Diceroprocta apache
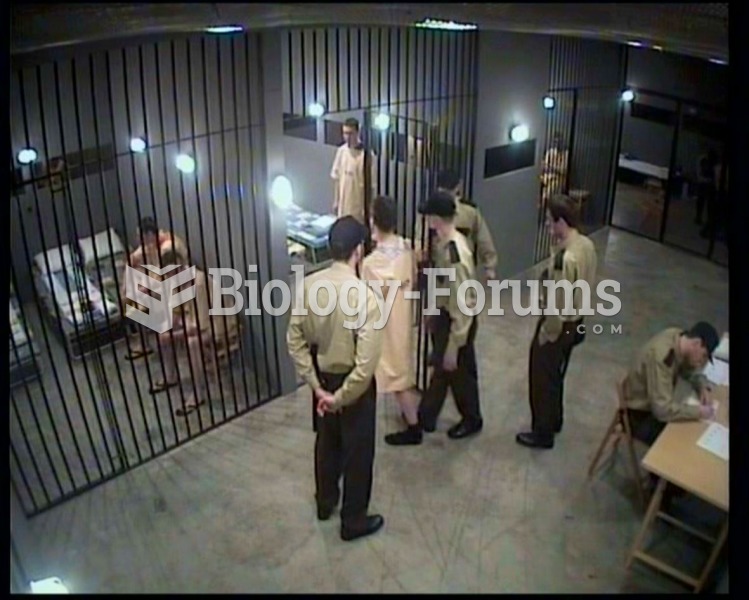 The notorious standford prison experiment
 Measuring Attachment Styles: The Strange Situation Experiment
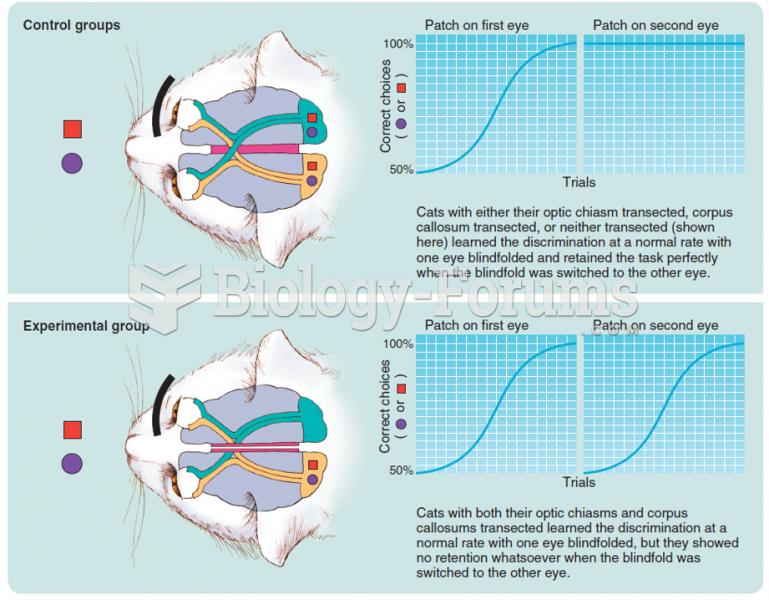 Schematic illustration of Myers and Sperry’s (1953) groundbreaking split-brain experiment. There ...
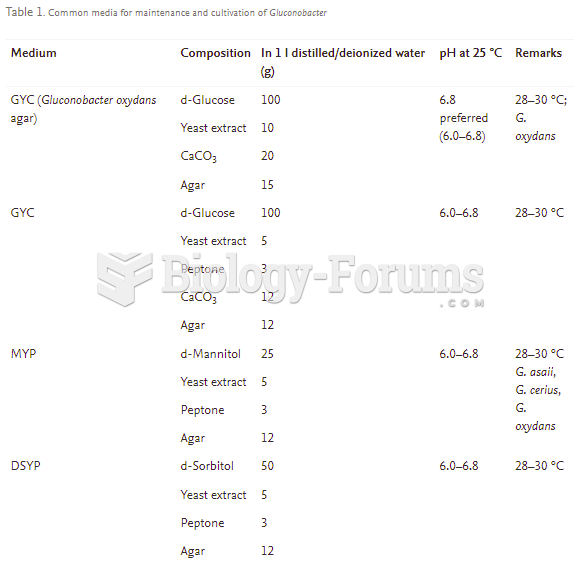 How to obtain more bacteria culture from already developed colony in HS medium
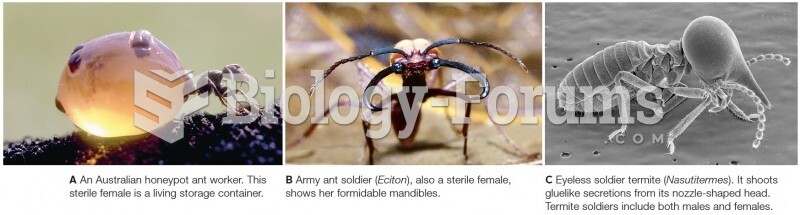 Specialized ways of serving and defending the colony.