This topic contains a solution. Click here to go to the answer
|
|
|

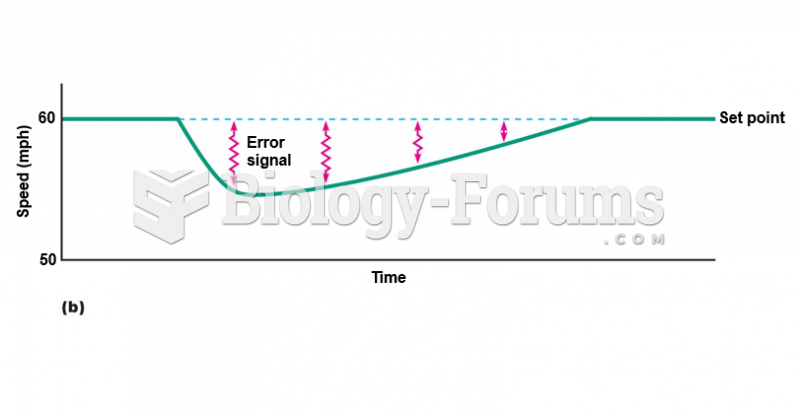 Negative feedback control of a regulated variable.
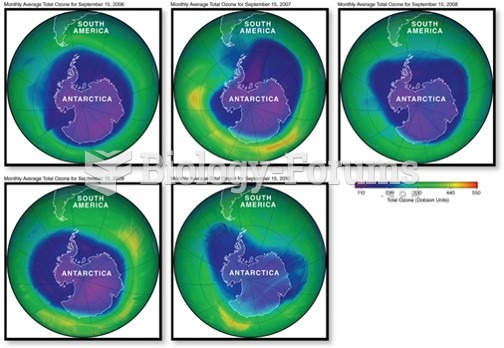 Variable Gases: Ozone
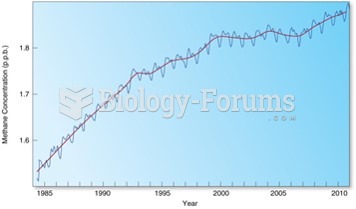 Variable Gases: Methane
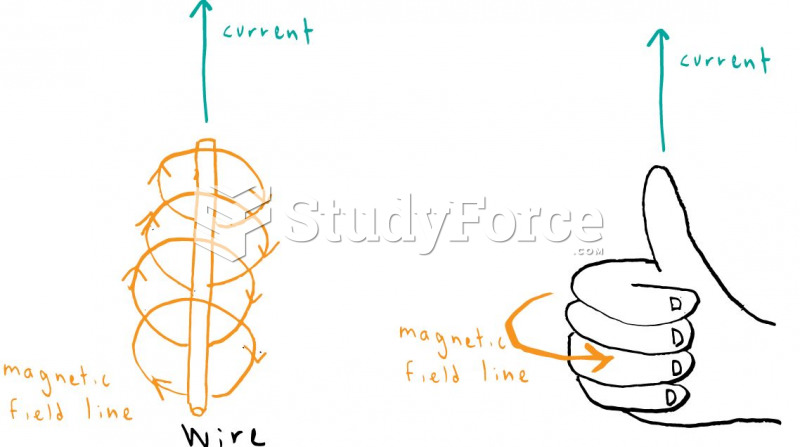 Right-hand Rule
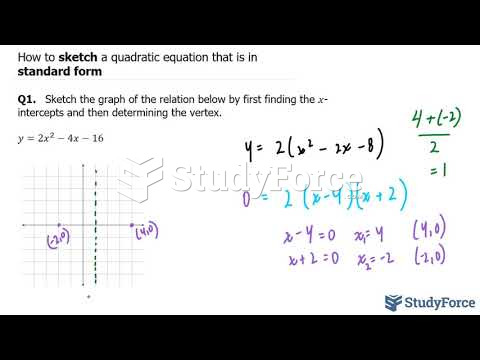 How to sketch a quadratic equation that is in standard form (Question 1)
 How to use Cramer's rule to solve a second-order determinant (Question 2)