This topic contains a solution. Click here to go to the answer
|
|
|

 Please provide me with a solution for part b.
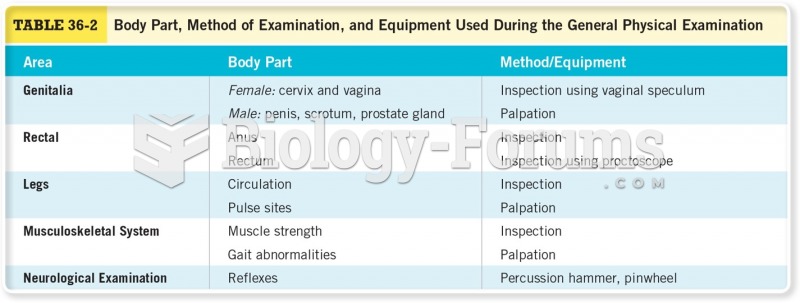 Body Part, Method of Examination, and Equipment Used During the General Physical Examination Cont
 How to find the unknown angle of a triangle using the sine law (Part 1)
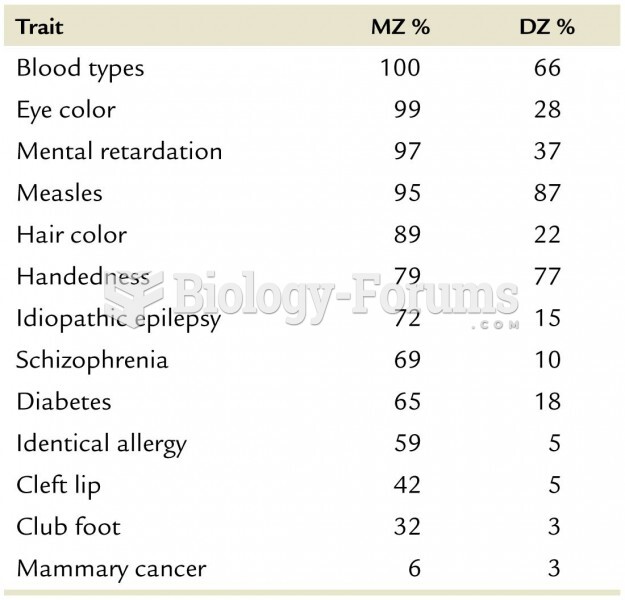 Estimates of Heritability for Traits in Different Organisms part 2
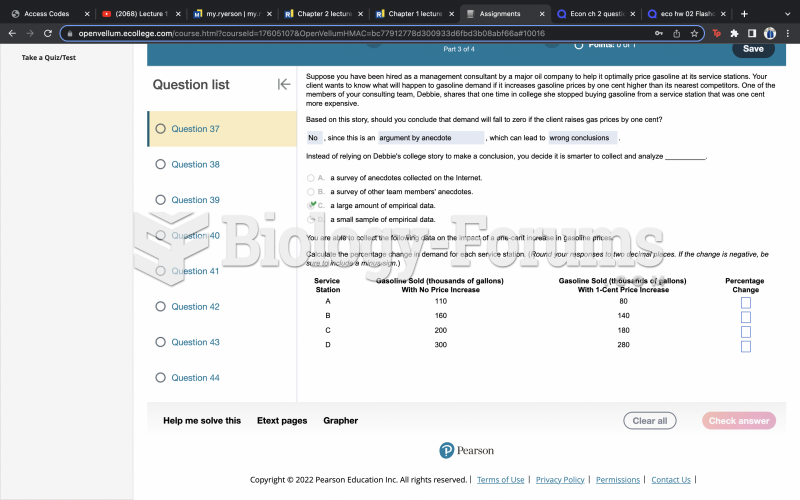
 Question 37 Part 2
 Question 37 Part 2