This topic contains a solution. Click here to go to the answer
|
|
|

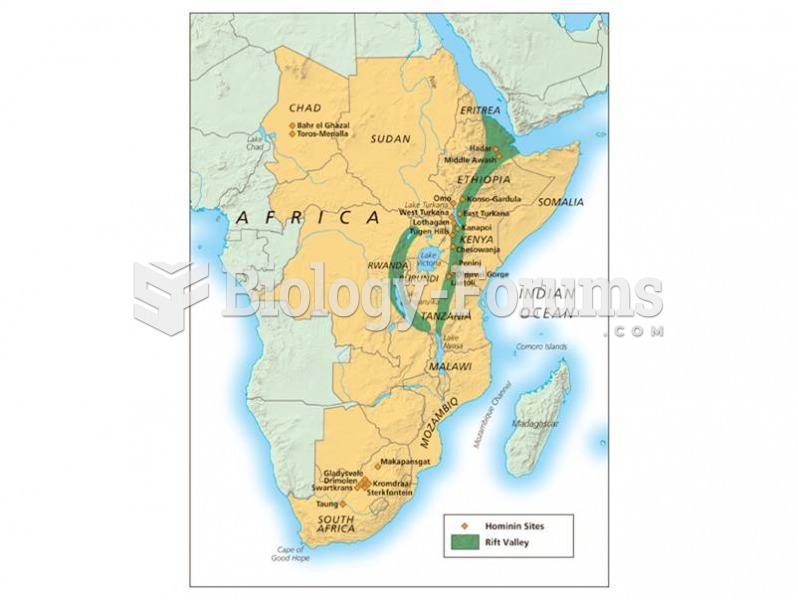 Geographic distribution of early hominins.
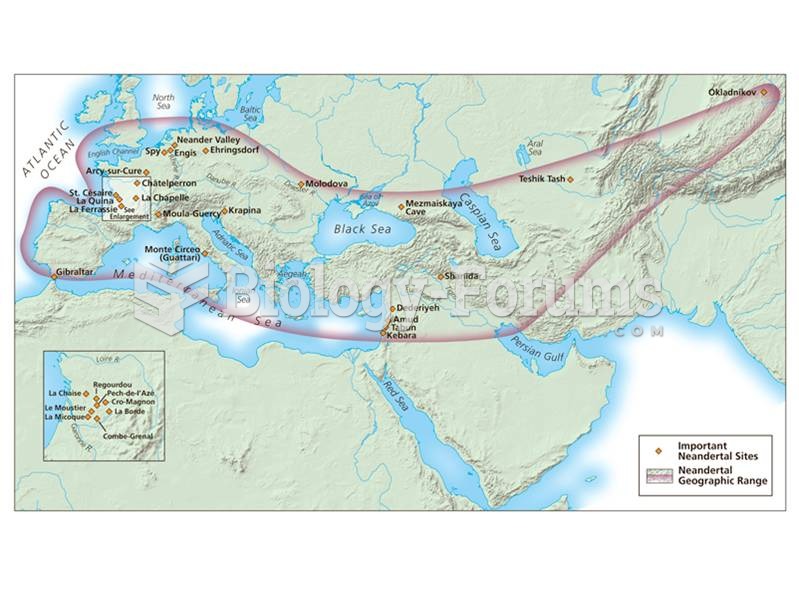 Distribution of Neandertal sites in Europe and western Asia.
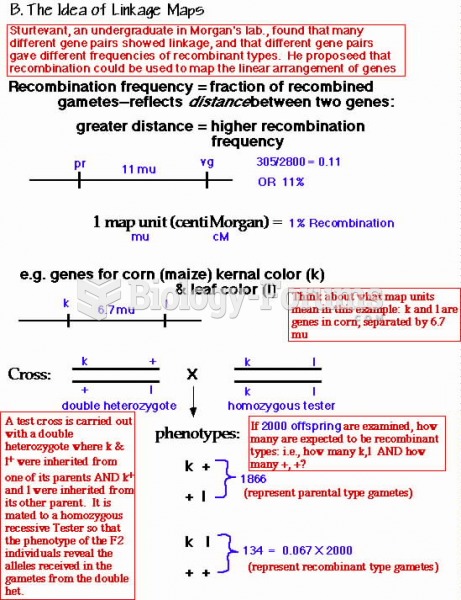 recombination frequency
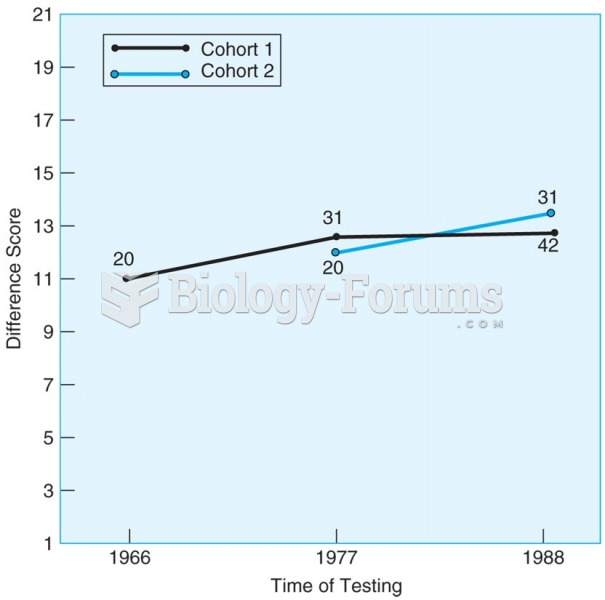 Mean scores for Erikson’s stage VI (Intimacy) for two cohorts. Scores for both cohorts increase ...
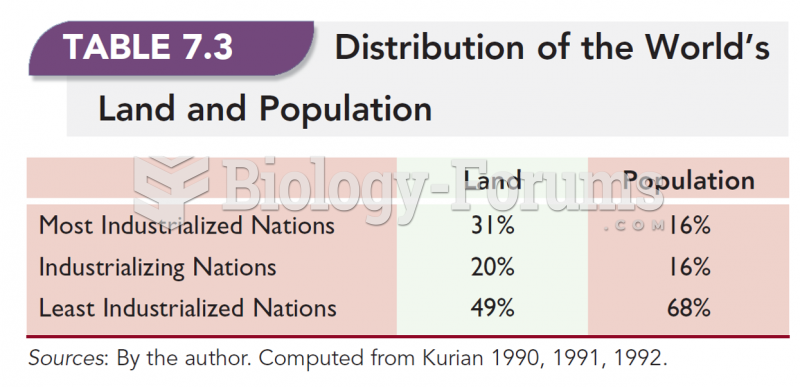 The Distribution of the World's Land and Population
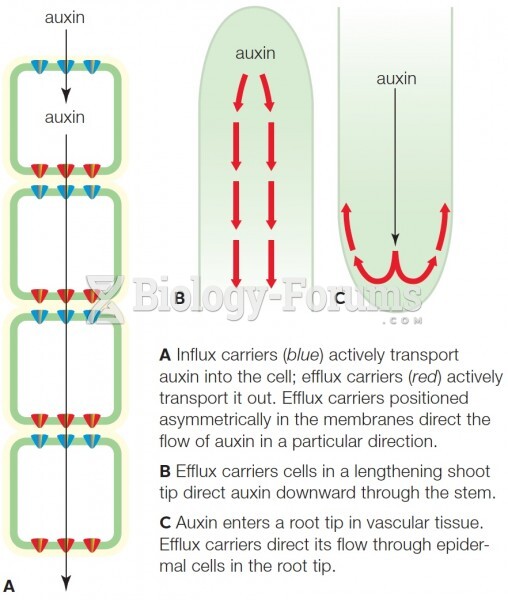 Polar distribution of auxin is driven by asymmetrical positioning of plasma membrane active transpor