This topic contains a solution. Click here to go to the answer
|
|
|

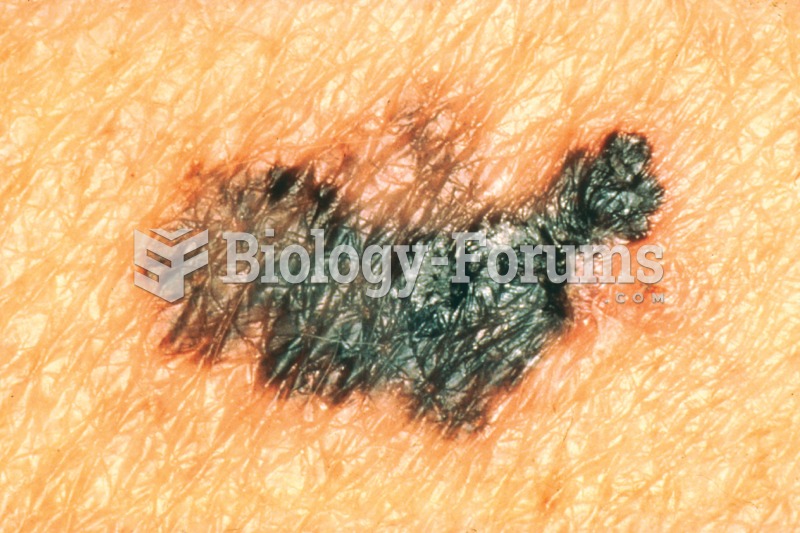 Malignant melanoma. This photograph demonstrates the highly characteristic color of this tumor.
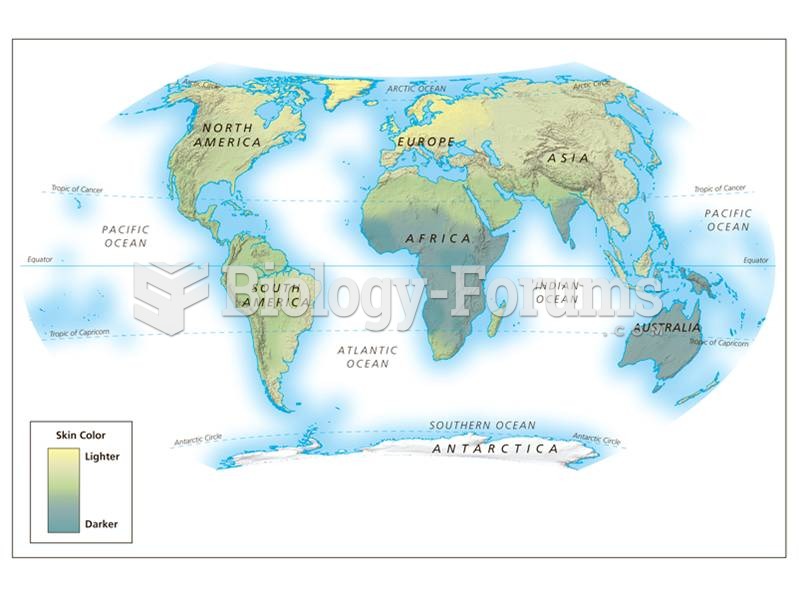 World map of the distribution of skin color.
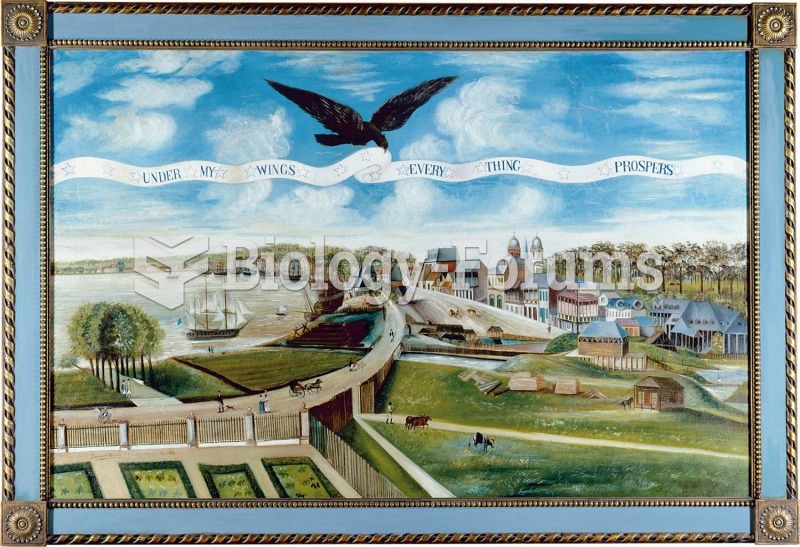 This painting depicts New Orleans in 1803, when the city was acquired—along with much of the modern
 Table
Table
 economic question
 economic question