|
|
|

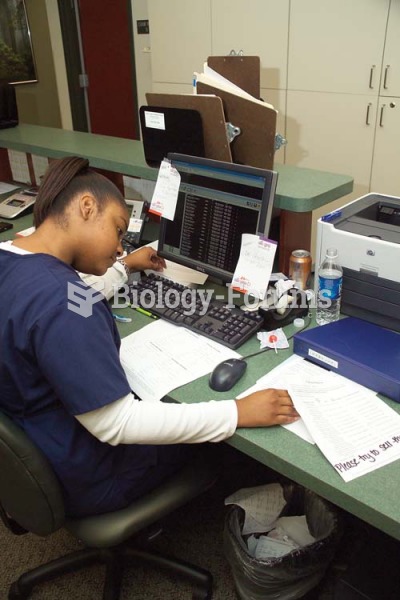 Critical thinking involves analysis in which the nurse examines patient data available from a variet
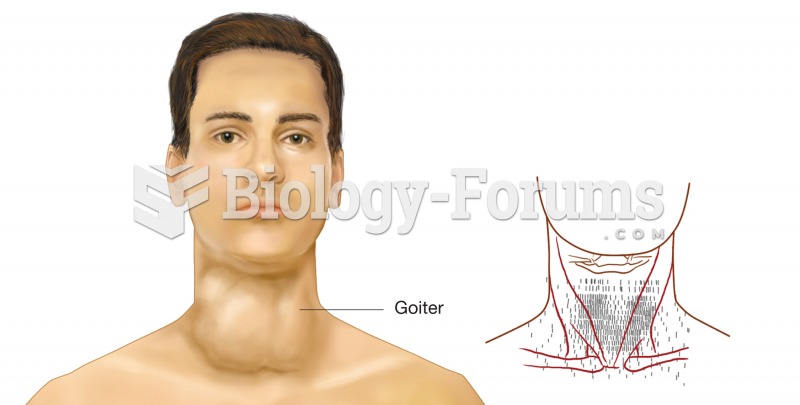 Thyroid scan. The right image is the data from a thyroid scan, printed on a superimposed map of the
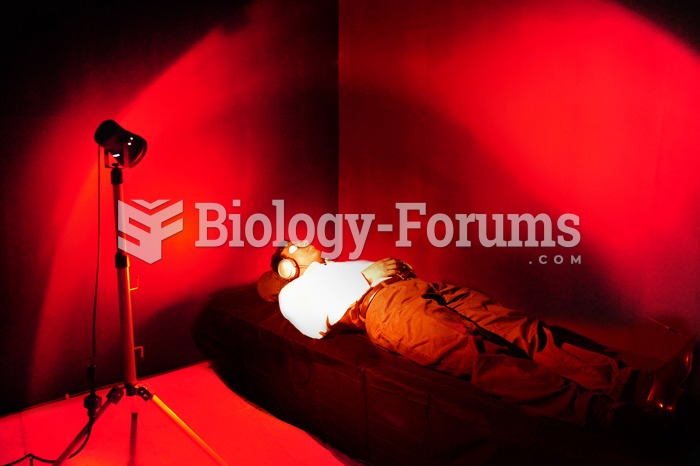 Ganzfeld experiment
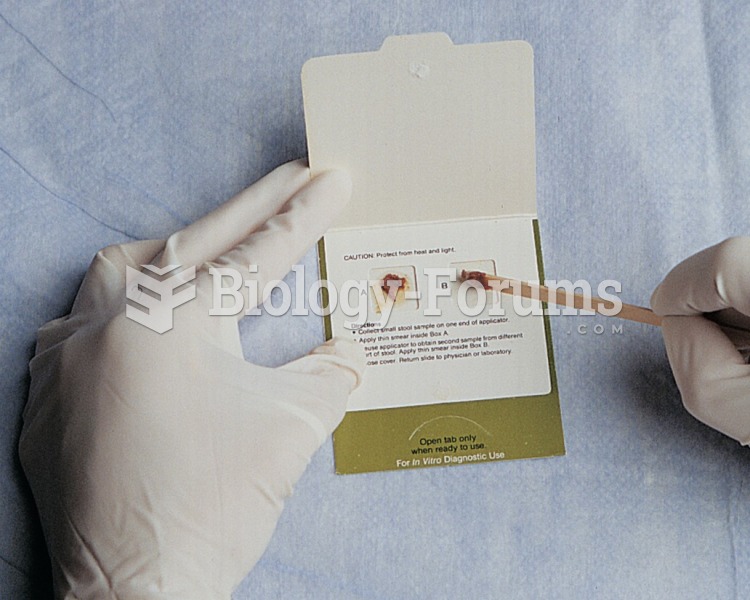 Instruct the patient to use an applicator to apply a small amount of stool in the appropriate boxes ...
 Light beer has about the same amount of alcohol as regular beer
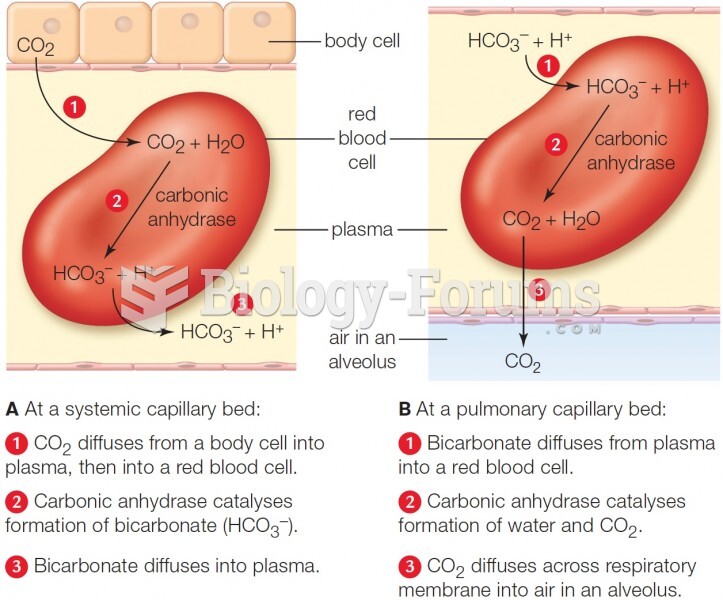 Main mechanism of carbon dioxide transport and exchange. A lesser amount of CO2 travels to the lungs