This topic contains a solution. Click here to go to the answer
|
|
|

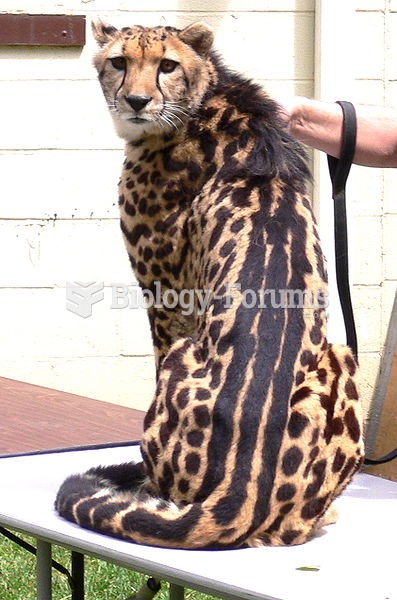 A king cheetah showing its distinctive coat pattern
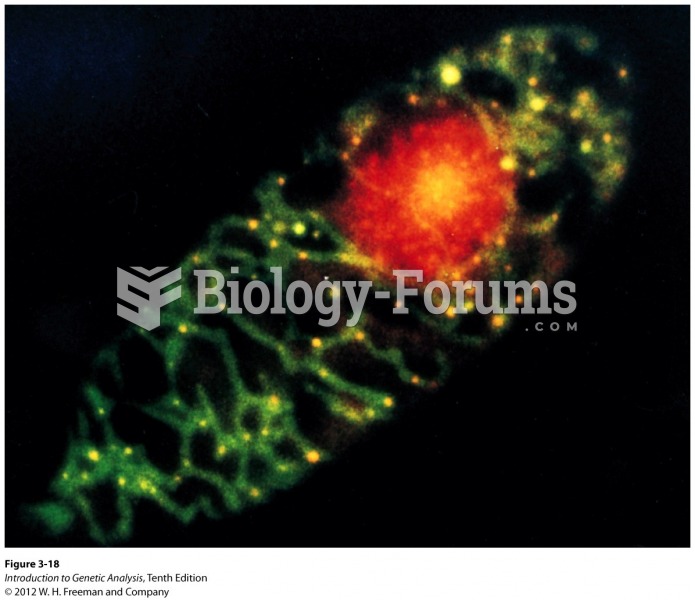 Cell showing nucleoids within mitochondria
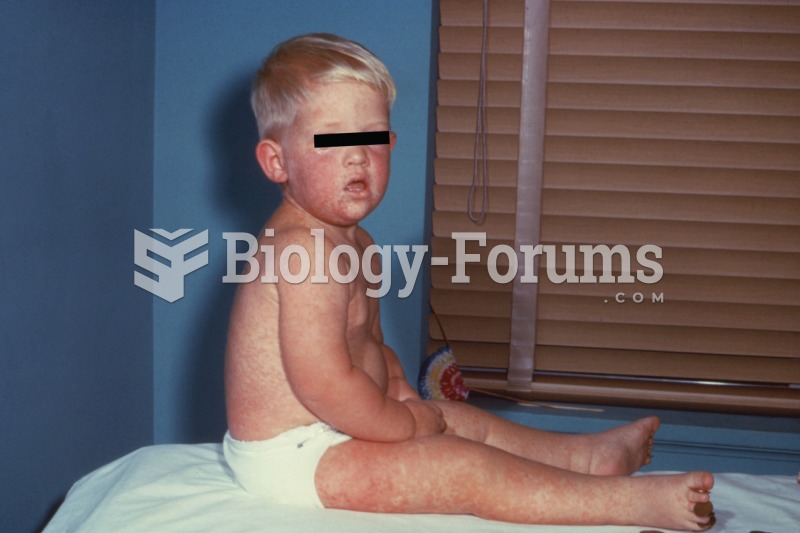 Measles. A photograph of a child stricken with measles, showing the tell-tale sign of the skin rash.
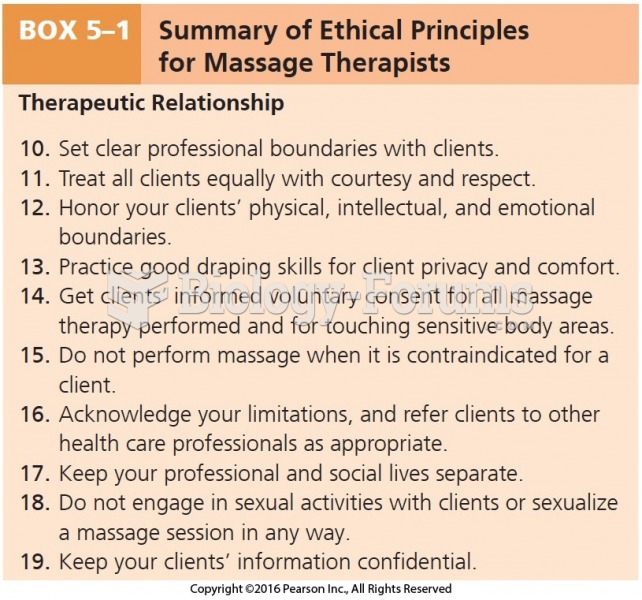 Summary of Ethical Principles for Massage Therapists Cont.
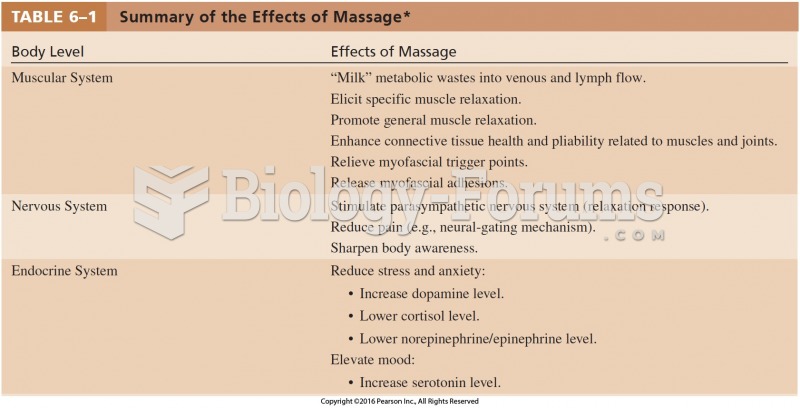 Summary of the Effects of Massage Cont.
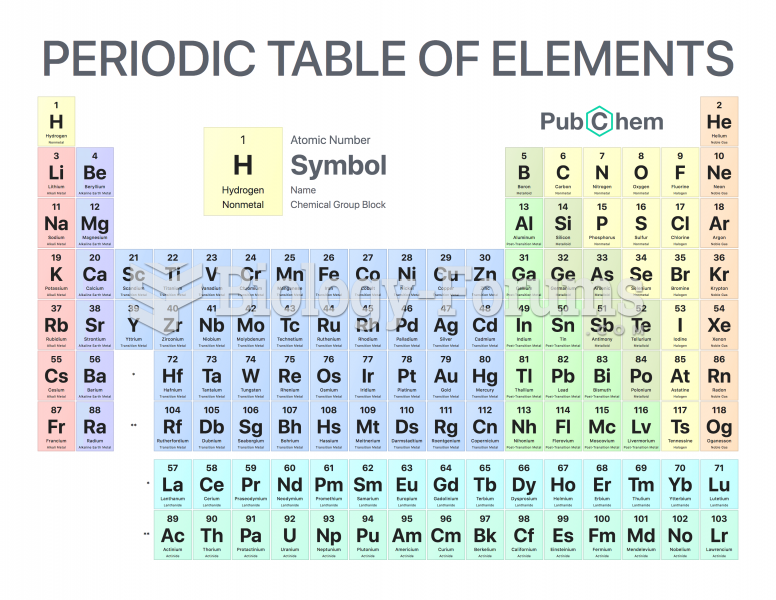 periodic table