This topic contains a solution. Click here to go to the answer
|
|
|

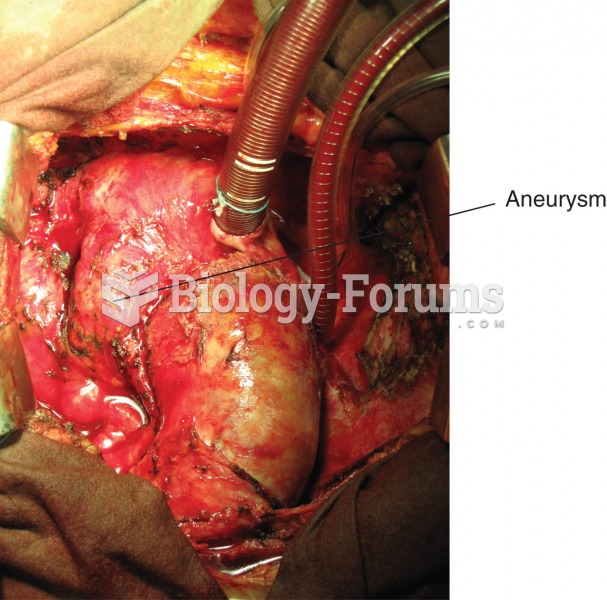 Aneurysm. Photograph of the aorta, the large blood vessel arising from the heart, with a large bulge
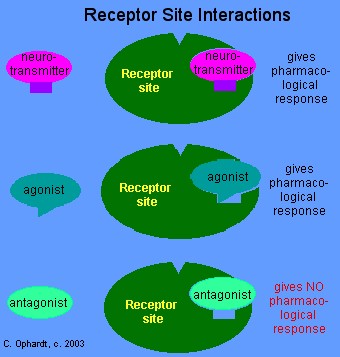 Drug Interaction with Receptor Site
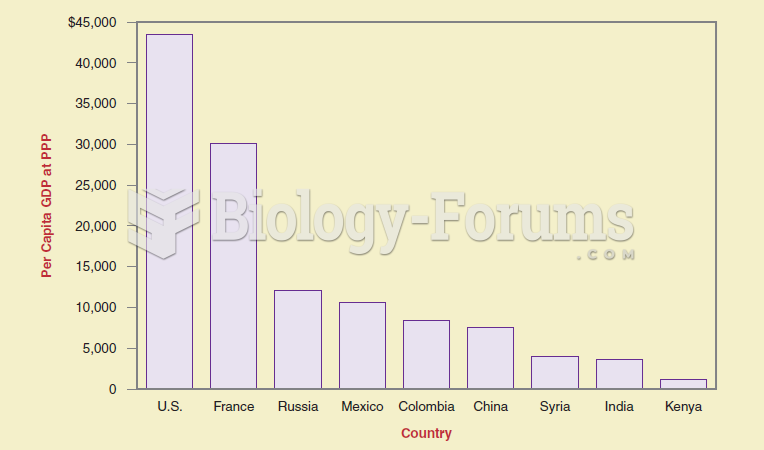 If you want to show differences between items at the same time, a bar graph is more effective than a
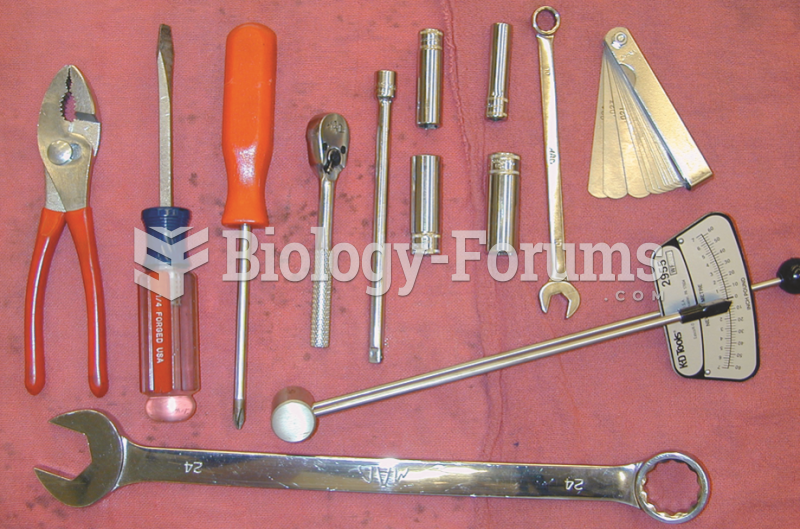 The tools necessary to adjust the valves on an engine with adjustable rocker arms include basic hand ...
 Positive velocity graph
 Graph Liters per Hour