|
|
|

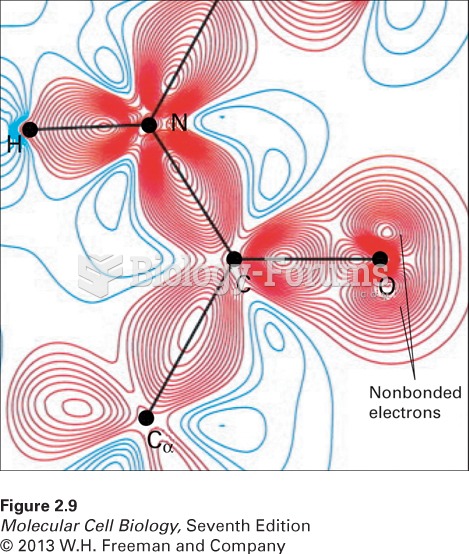 Distribution of bonding and outer nonbonding electrons in the peptide group
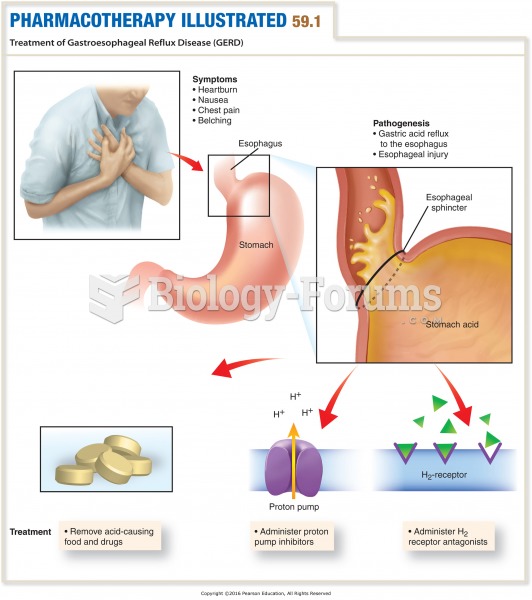 Treatment of Gastroesophageal Reflux Disease (GERD)
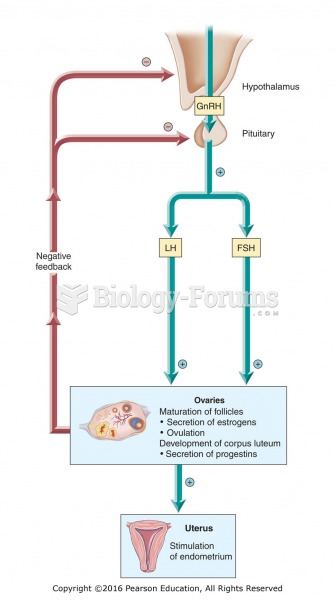 Negative feedback control of the female reproductive hormones.
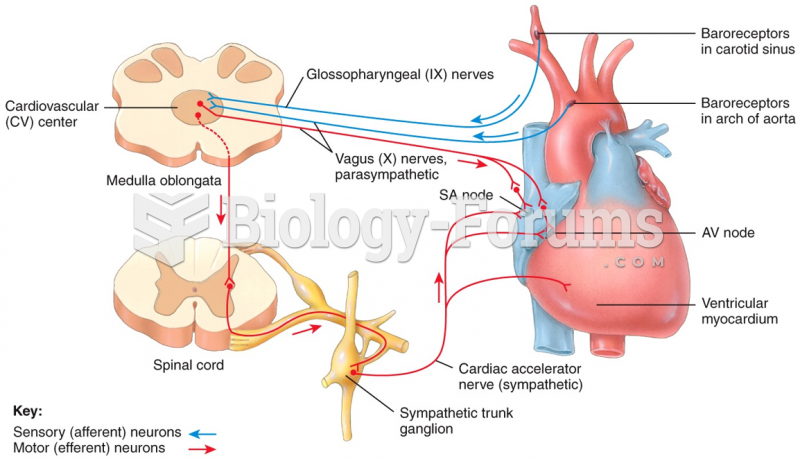 Control of BP and Blood Flow
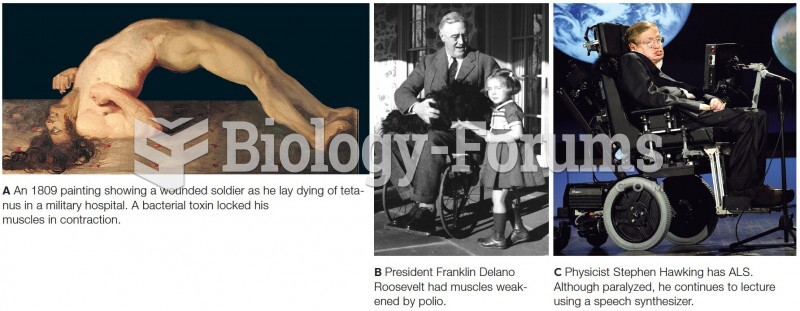 Results of disrupted control of skeletal muscles
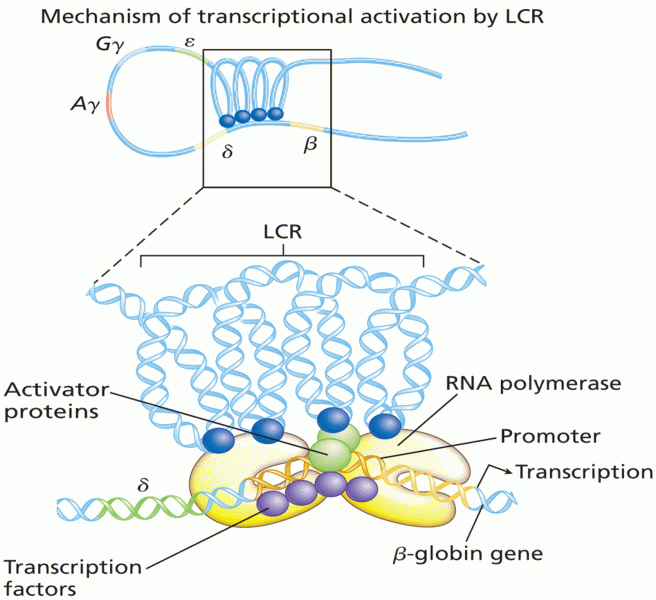 Human beta-globin–complex locus control region