This topic contains a solution. Click here to go to the answer
|
|
|

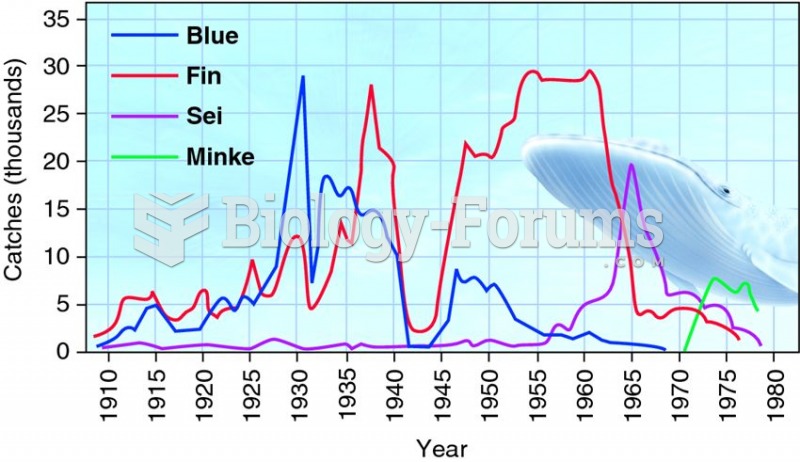 Sequential decline of whale catches in the Antarctic shows the strong effect of human predators.
 In 2008, the U.S. economy suffered a gaping wound as several trillion dollars were ripped out of it.
 Barenaked Ladies - Lovers in a Dangerous Time
 How to manually solve and graph any quadratic equation
 Sketch the graph of each function using transformations. State the domain and range.
 Offset Method Plot of Land