This topic contains a solution. Click here to go to the answer
|
|
|

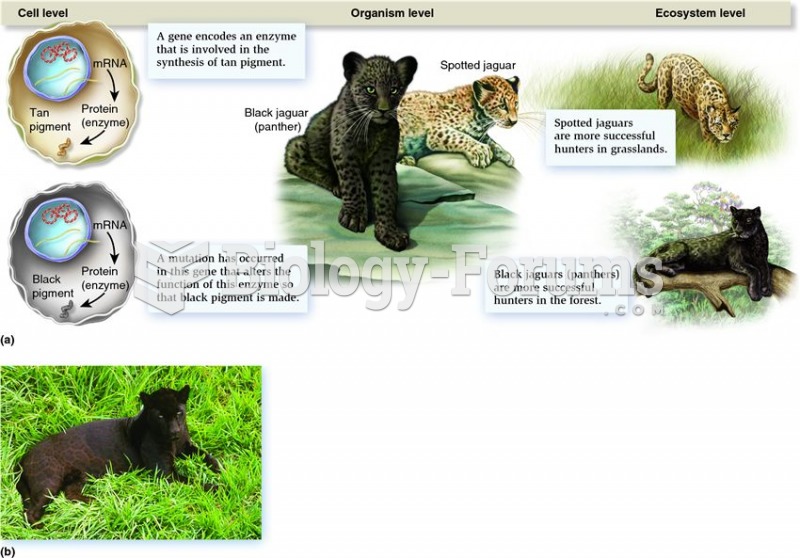 How the study of genomes and proteomes can provide us with connections to different biological level
 Dental topography differs between A. Afarensis and H. erectus, suggesting the australopithecine teet
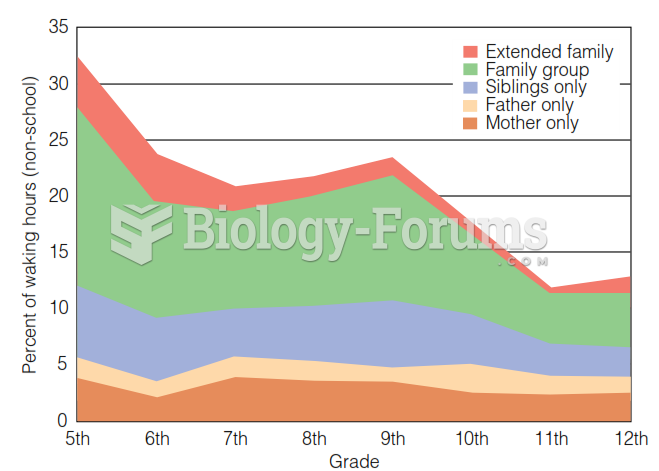 ESM Study of Time Spent with Family
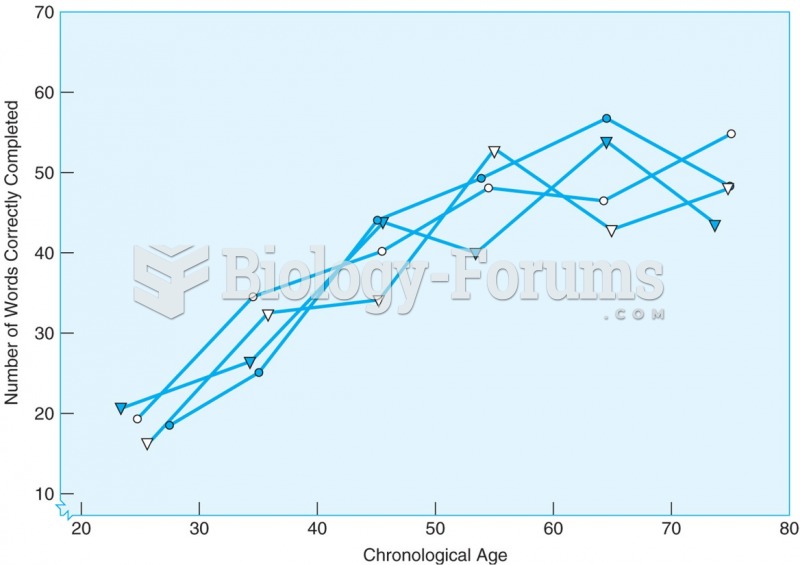 The number of words correctly completed in the New York Times crossword puzzle increases with age ...
 How to multiply a complex number by its conjugate
 How to use the discriminant to determine the number of roots for any quadratic equation