|
|
|

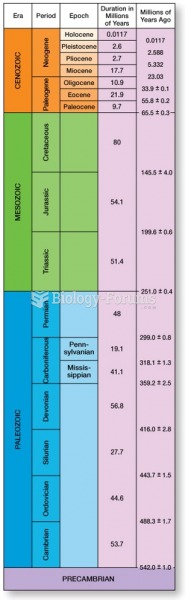 Earth scientists have devised a scheme to divide the planet’s natural history into distinct time ...
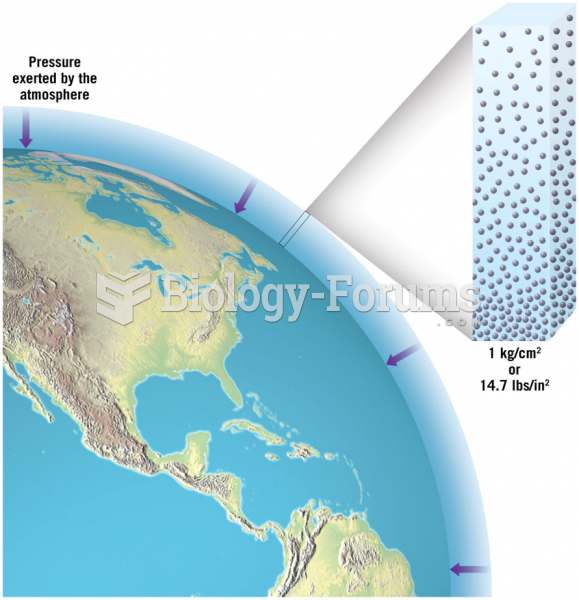 Sea-Level Pressure
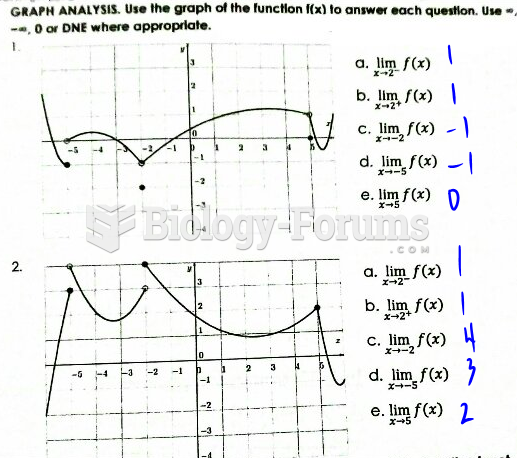 Use the graph of the function f(x) to answer each question.
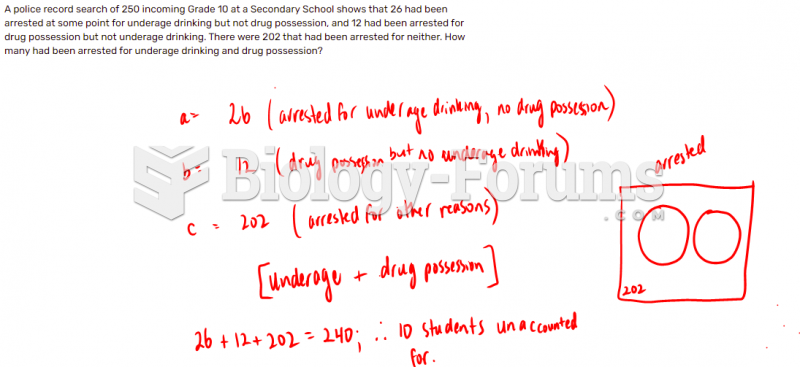 A police record search of 250 incoming Grade 10 at a Secondary School shows that 26 had been ...
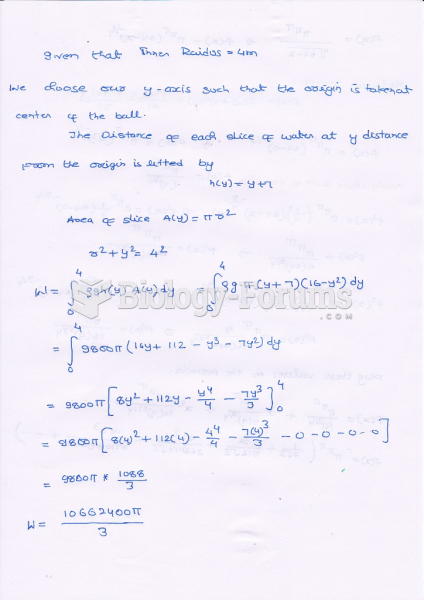 A spherical water tank with an inner radius of 4 m has its lowest point 3 m ...
 Time-of-entry mapping