This topic contains a solution. Click here to go to the answer
|
|
|

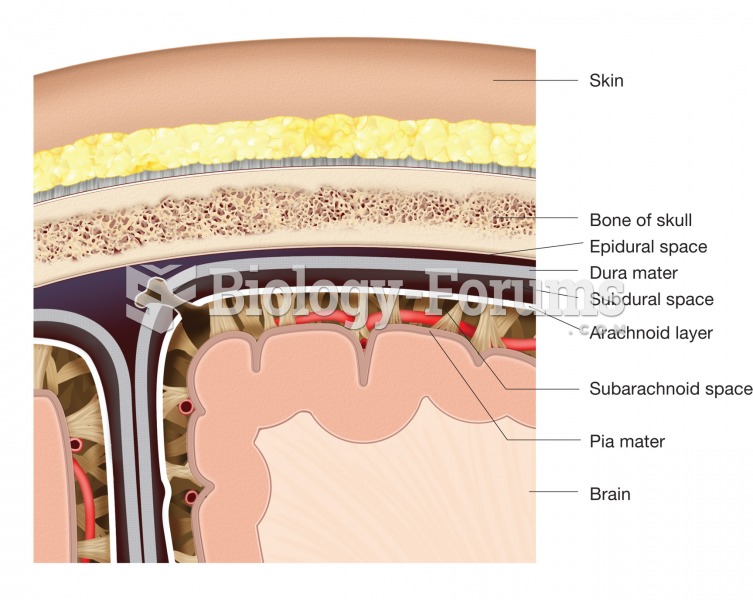 The meninges. This figure illustrates the location and structure of each layer of the meninges and t
 Continuum of aggression. Based on an unpublished figure by Joanne DeSanto Iennaco.
 Find the factor demand for labour and the amount of output it will produce. Show all ...
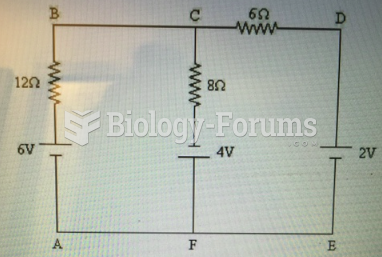 Identify the junction nodes in the circuit shown in Figure 21-1.
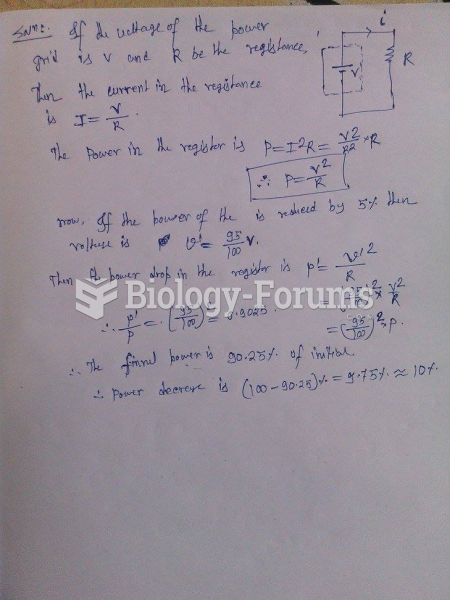 During a period of high power demand, the voltage output of the power company is reduced by ...
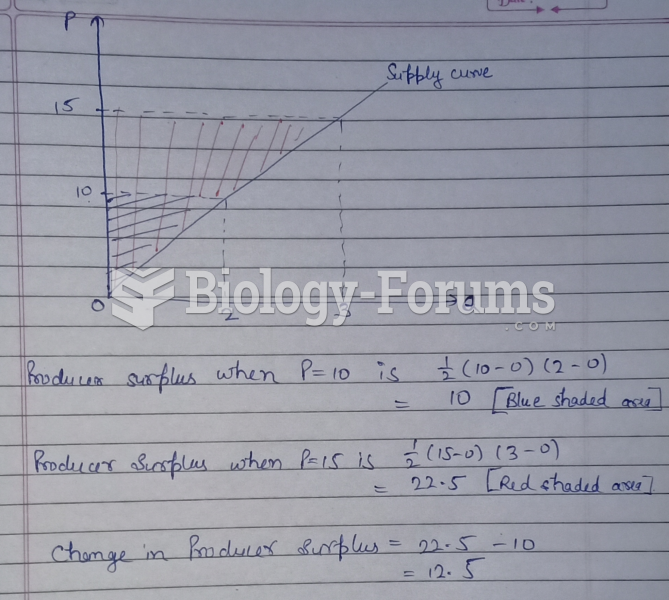 Suppose the market supply curve is p = 5Q. If price increases from 10 to 15, the change in ...