This topic contains a solution. Click here to go to the answer
|
|
|

 Hydrocephalus. The figure on the left is a child with the enlarged ventricles of hydrocephalus. The
 Ugonachomma display figure, Igbo, Nigeria.
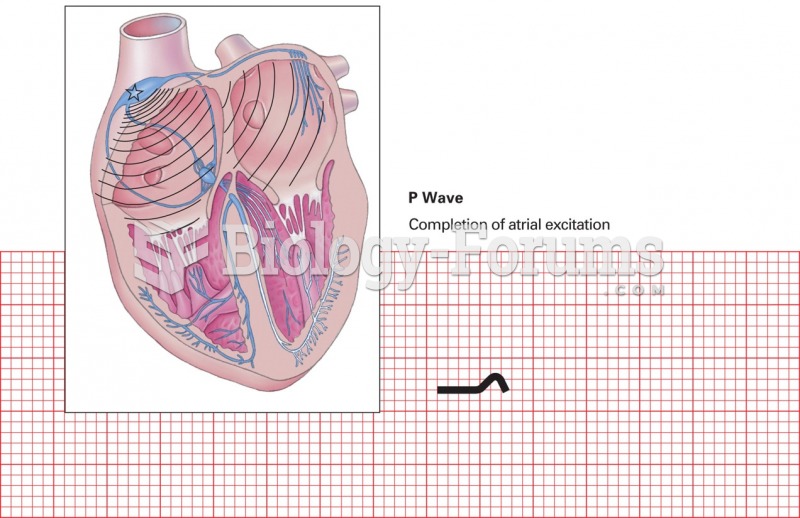 P wave (SA node initiates atrial depolarization).
 Figure-8s at the knuckles of the hand.
 Figure and Ground
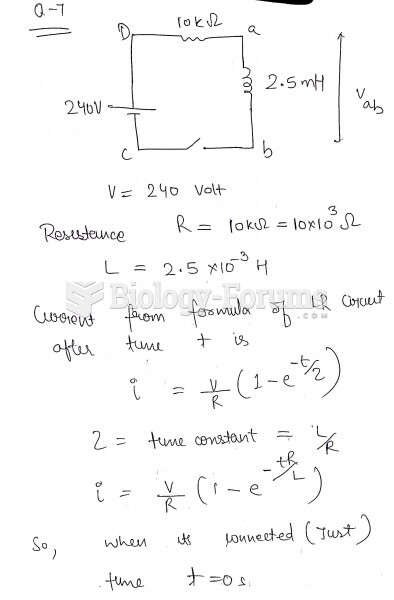 The figure shows an LR circuit with a switch and a 240-volt battery. At the instant the switch ...