This topic contains a solution. Click here to go to the answer
|
|
|

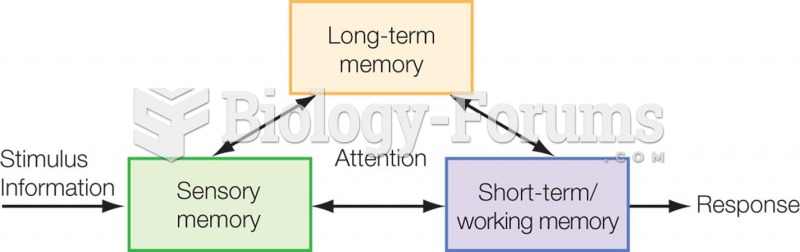 Information Processing Model The components of the model operate simultaneously.
 Question continued
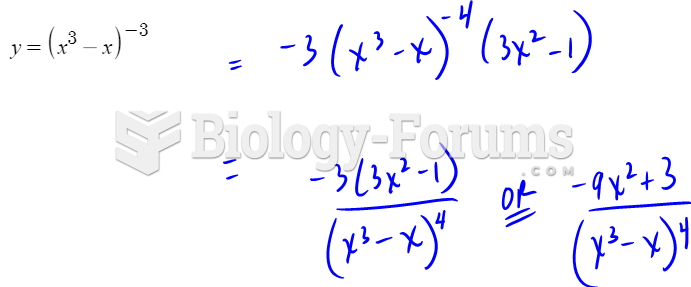 Find the derivative by using the chain rule, question 2
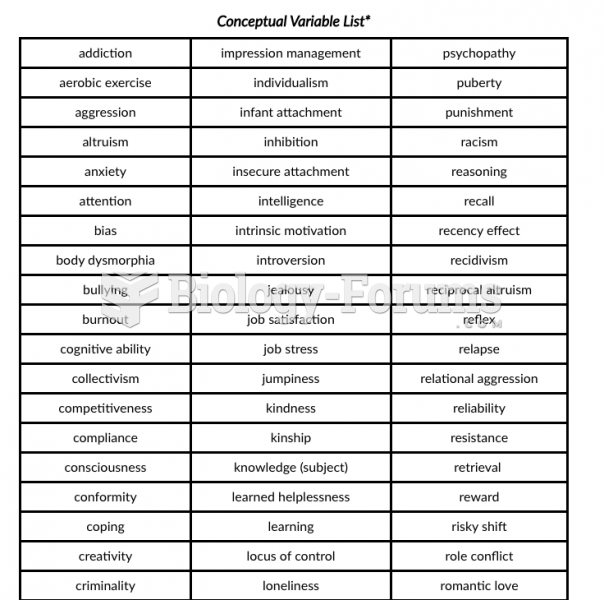 the list provided
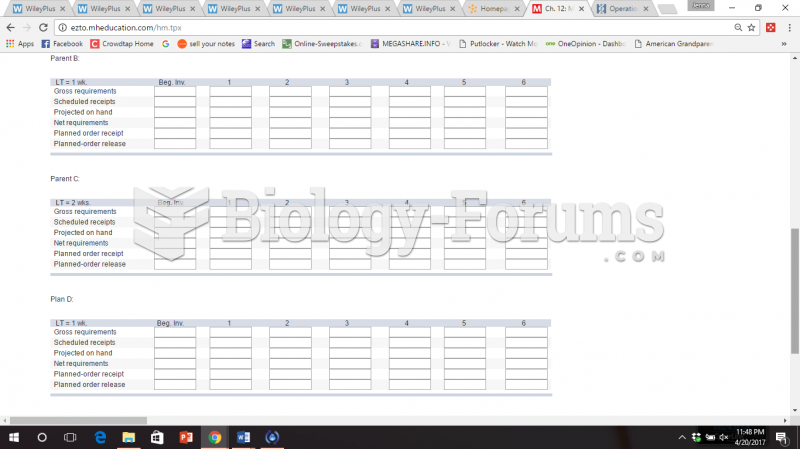
 Economics question
 Flowchart illustrating how genetic information encoded in DNA produces protein