This topic contains a solution. Click here to go to the answer
|
|
|

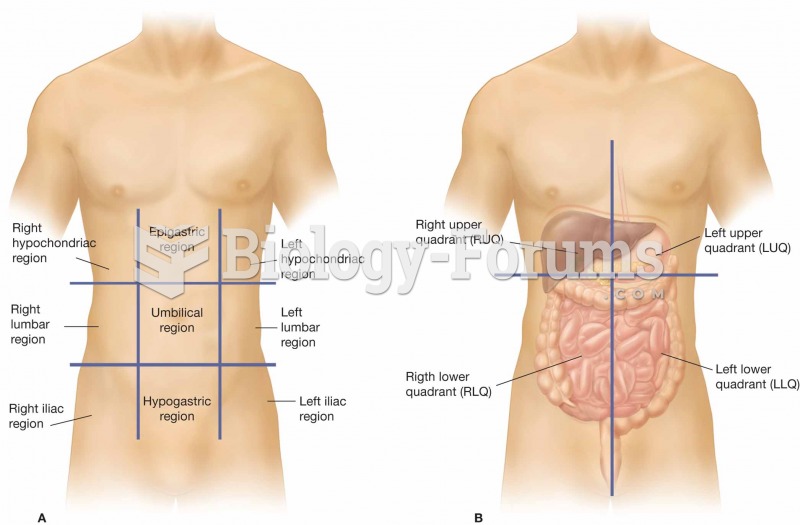 (A) The nine regions of the abdominopelvic cavity. (B) The four regions of the abdomen, which are re
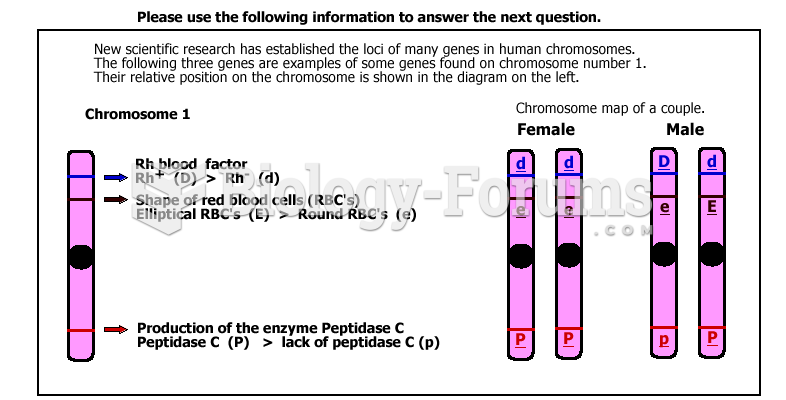 Chart to answer QN
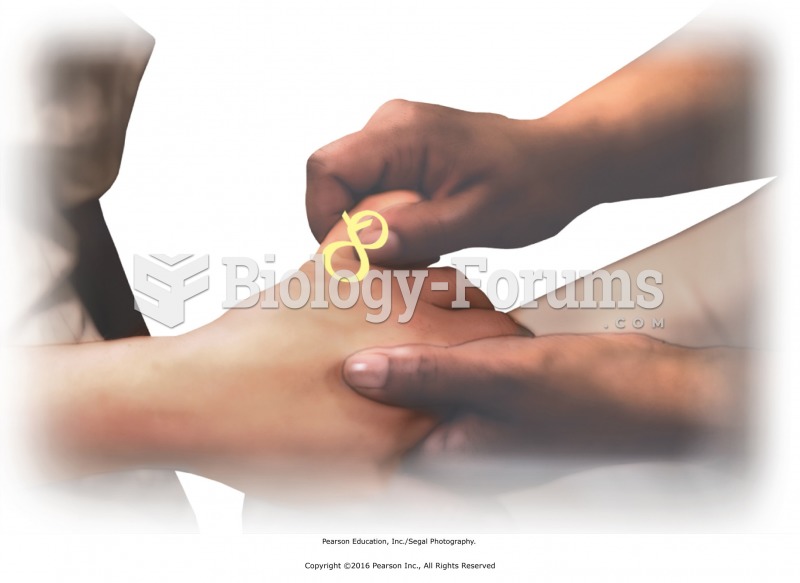 Joint movement of the fingers. Apply scissoring at the knuckles and figure-8s to the fingers to ...
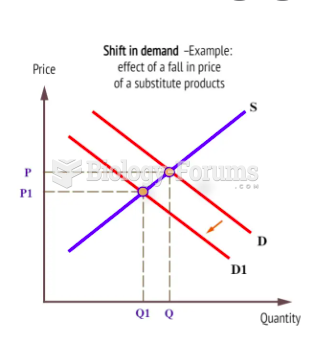
 Economics question
 economic question
 Eco question 2