This topic contains a solution. Click here to go to the answer
|
|
|

 DEVELOPING A PICOT QUESTION
 Everyday situations sometimes present opportunities for children to build information processing ...
 Demonstrate the Application of Triangular, Figure-Eight, and Tubular Bandages
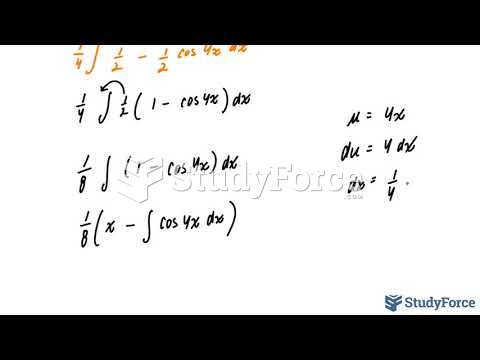 How to integrate trigonometric functions containing even powers (Question 2)
 economic question
 economic question