This topic contains a solution. Click here to go to the answer
|
|
|

 How to integrate using inverse trigonometric substitution (Question 4)
 How to solve word problems with two unknowns (Question 1)
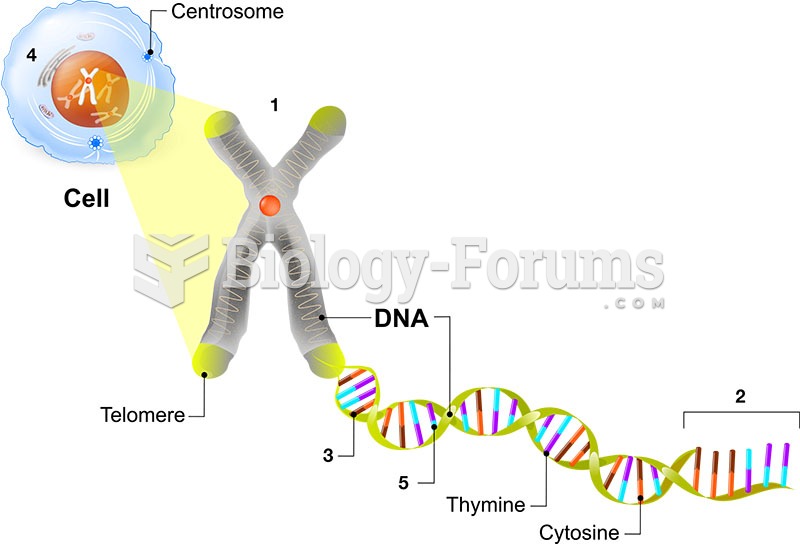 Molecular Genetics DNA picture matching question
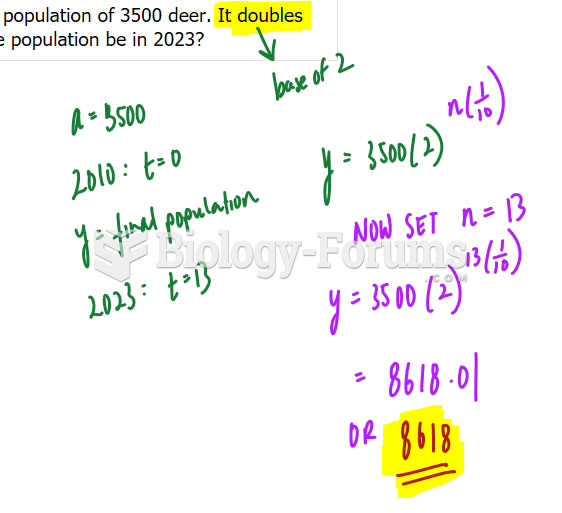 Exponential Growth Question
 economic question
 economic question