This topic contains a solution. Click here to go to the answer
|
|
|

 A question for grade 11 math
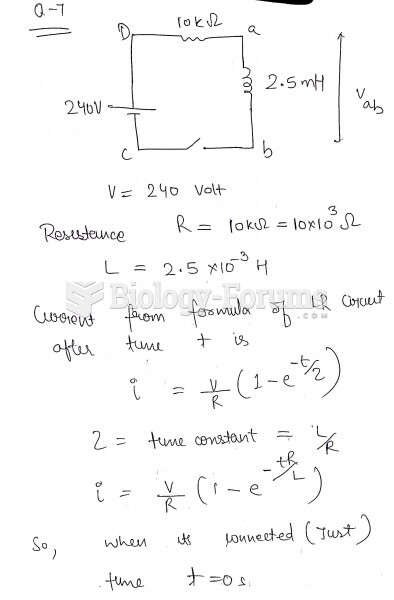 The figure shows an LR circuit with a switch and a 240-volt battery. At the instant the switch ...
 The flow of genetic information
 this is a math question
 this is a math question
 Hi i really need help clarifying this question T^T