This topic contains a solution. Click here to go to the answer
|
|
|

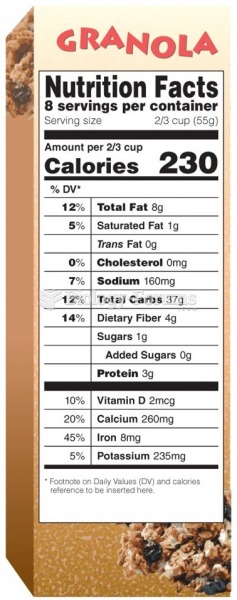 Food Labels Provide Nutrient Content Information
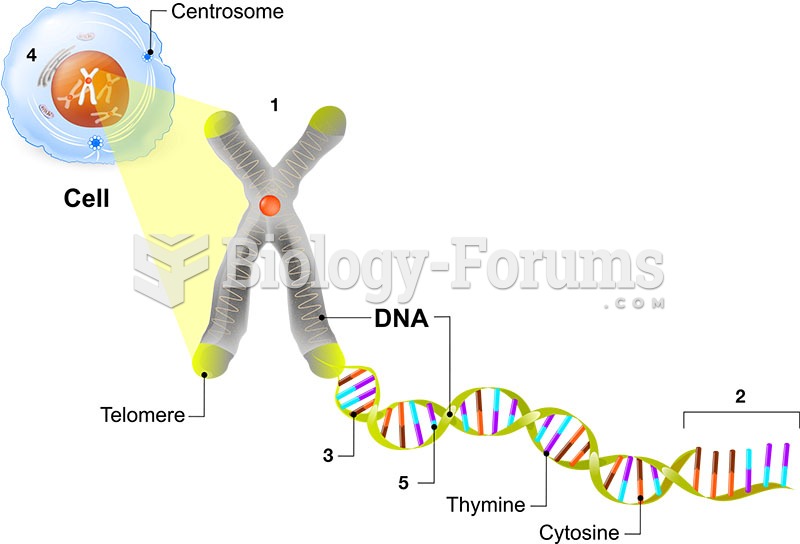 Molecular Genetics DNA picture matching question
 economic question
 economic question
 Question about Resultant of gravitational force?
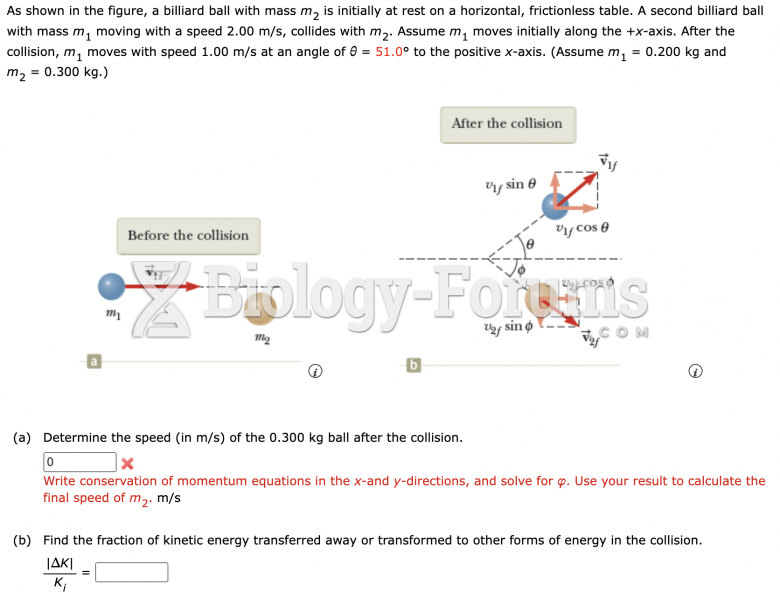 a billiard ball physics question