This topic contains a solution. Click here to go to the answer
|
|
|

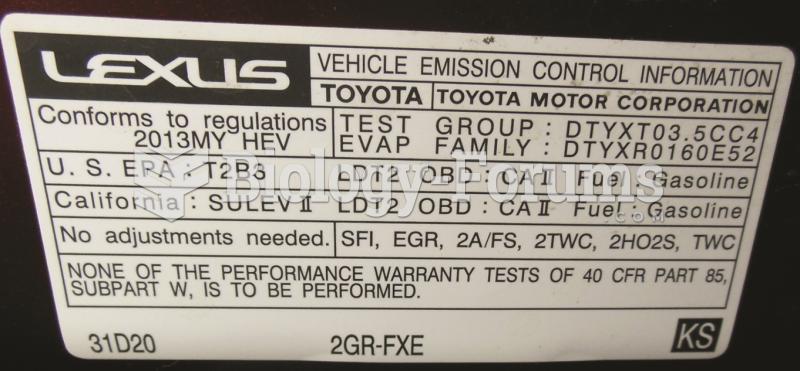 The vehicle emissions control information (VECI) sticker is placed under the hood.
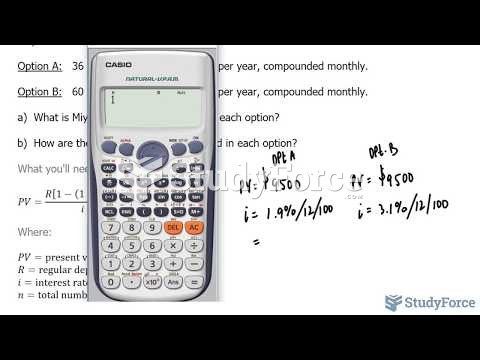 How to choose the right payment plan with changing conditions (Question 2)
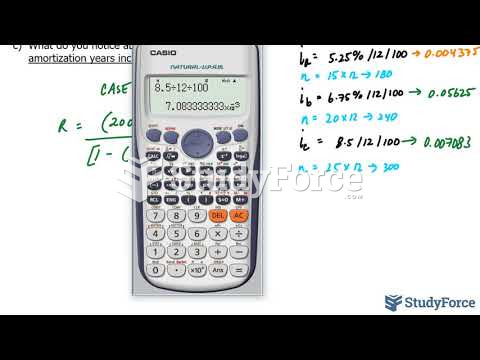 How to calculate monthly payments at varying amortization periods (Question 3)
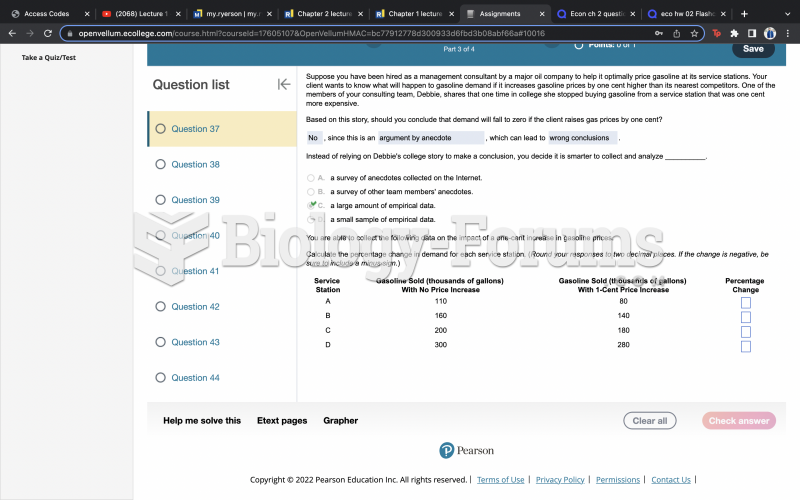 Question 37 Part 2
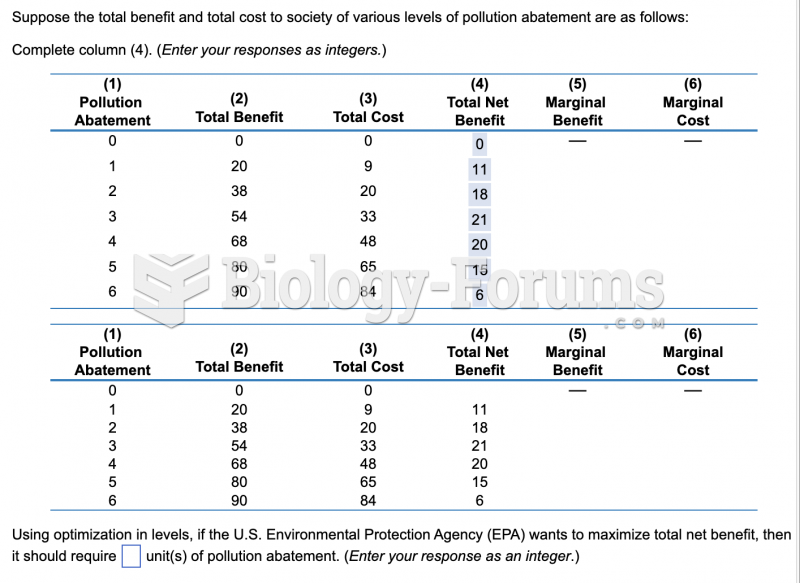 economic question
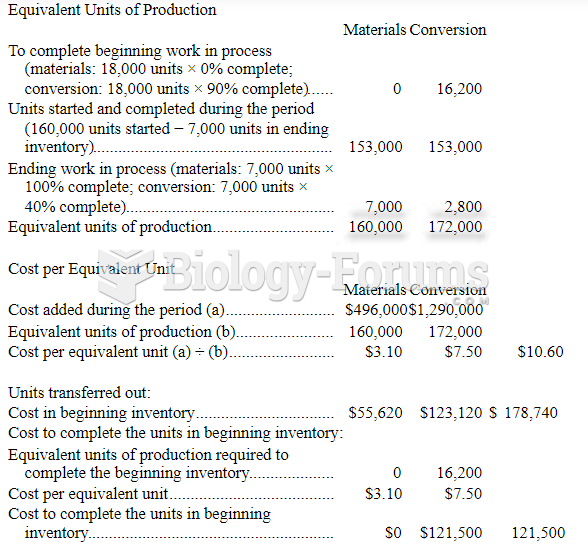 The following information relates to the Cutting Department of Kittina Corporation for the ...