This topic contains a solution. Click here to go to the answer
|
|
|

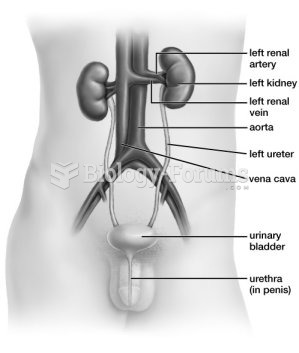 Based on this figure, what pathway is used during urinary catheterization, in which a tube is ...
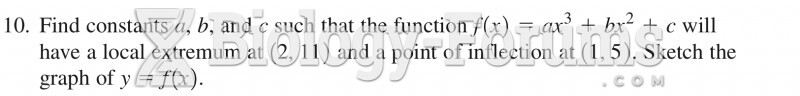
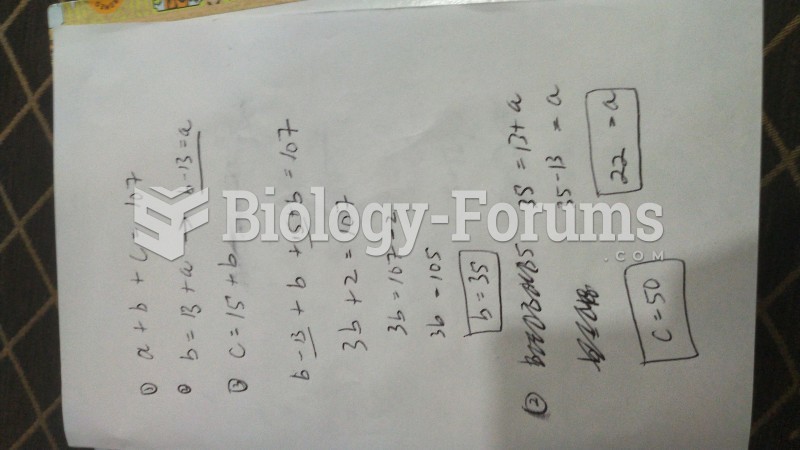 Answer to math problem
 answer only
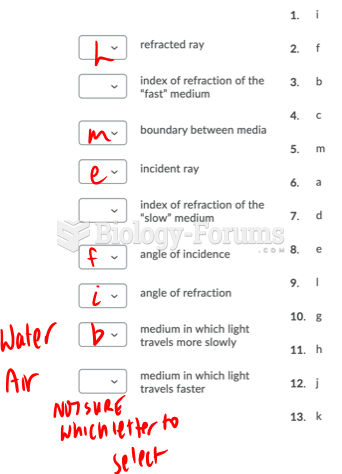 Can anyone help me with this matching question
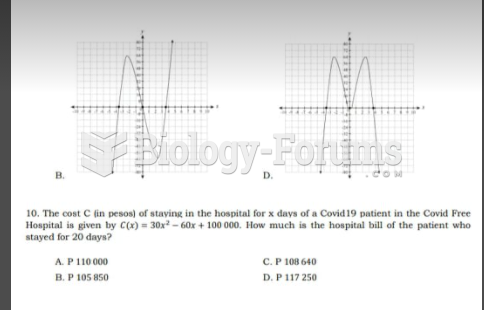
 economic question
 Question