This topic contains a solution. Click here to go to the answer
|
|
|

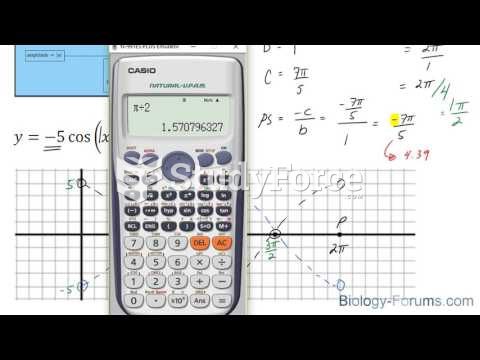 How to plot a cosine function containing an amplitude and phase-shift (Question 2 of 2)
 How to evaluate third-order determinants by Minors Method (Question 2)
 Figure and Ground
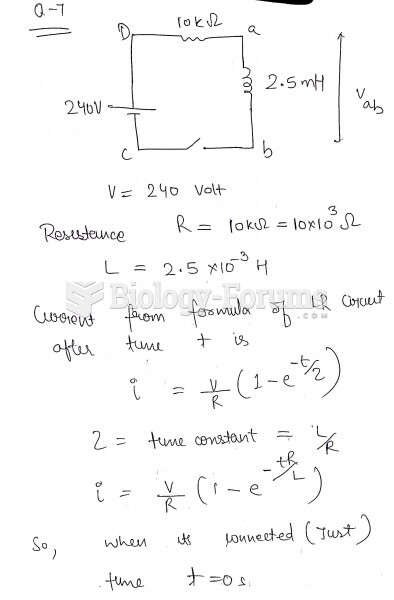 The figure shows an LR circuit with a switch and a 240-volt battery. At the instant the switch ...
 ODDS AND PROBABILITY PLEASE ANSWER ALL I DONT HAVE ENOUGH CREDITS
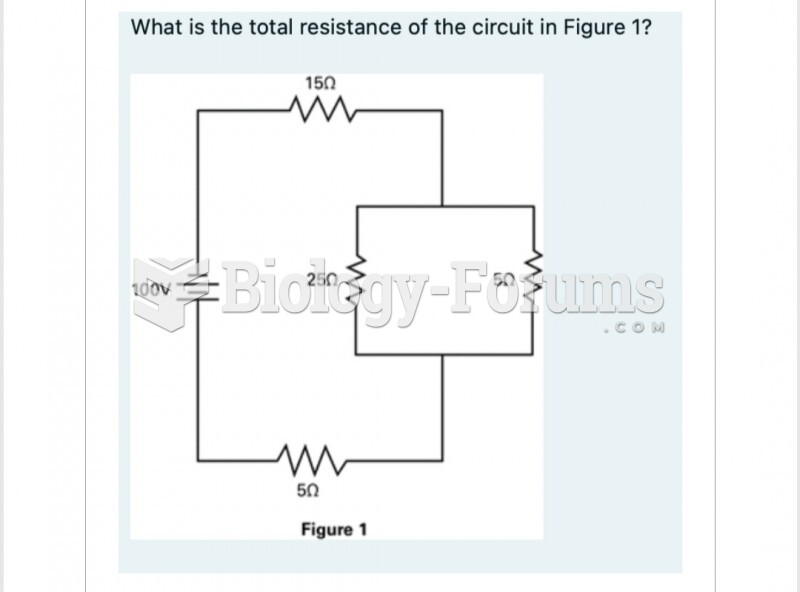 What is the total resistance of the circuit in Figure 1? 150