This topic contains a solution. Click here to go to the answer
|
|
|

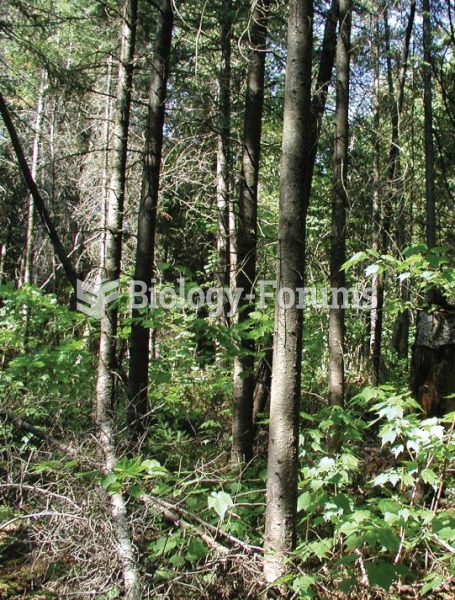 Changes in boreal forest composition along a chronosequence in Quebec. Dates refer to the year of th
 In 2013, Americans learned that the federal government massively surveys their phone calls and e-mai
 How to create a table of values displaying commission and earnings (Question 2)
 Economics question
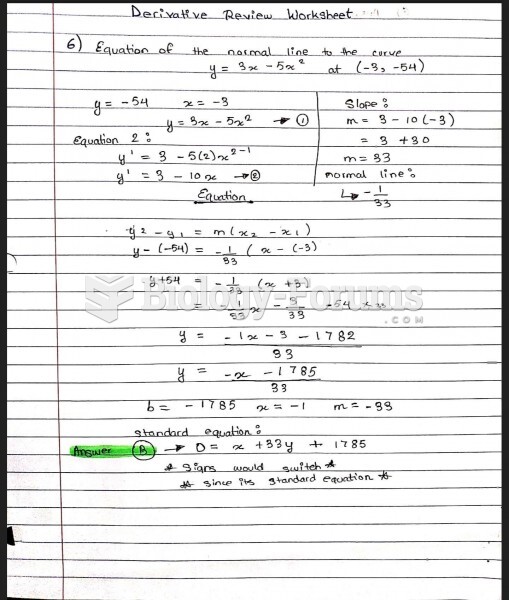
 Math question
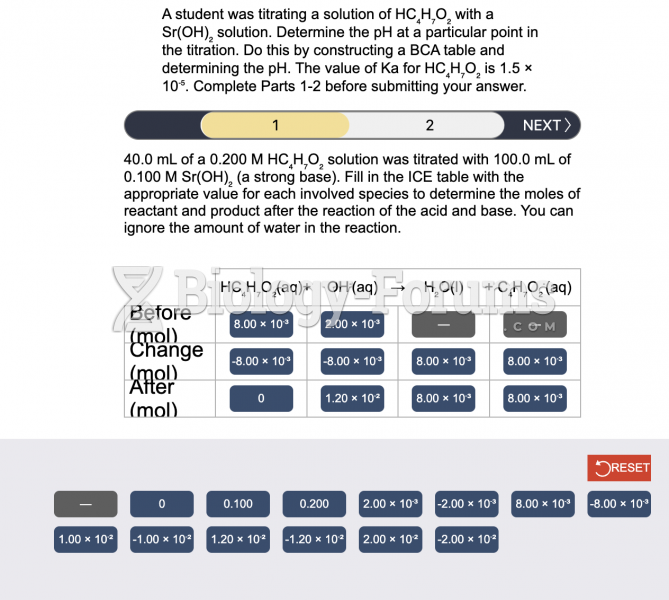 Chem question