This topic contains a solution. Click here to go to the answer
|
|
|

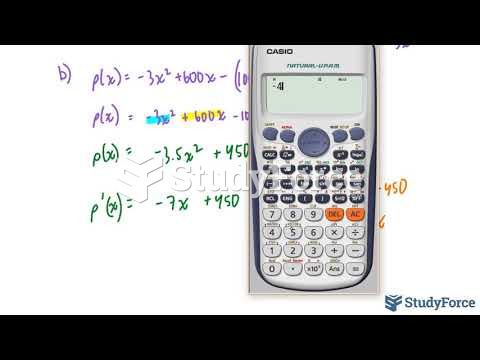 How to solve optimization problems in calculus (Question 8)
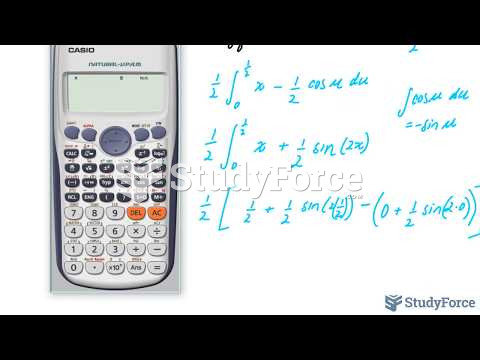 How to integrate trigonometric functions containing even powers (Question 1)
 Statuette of a Male Figure
 Cereal-box readers will read the information on the box as many as 12 times
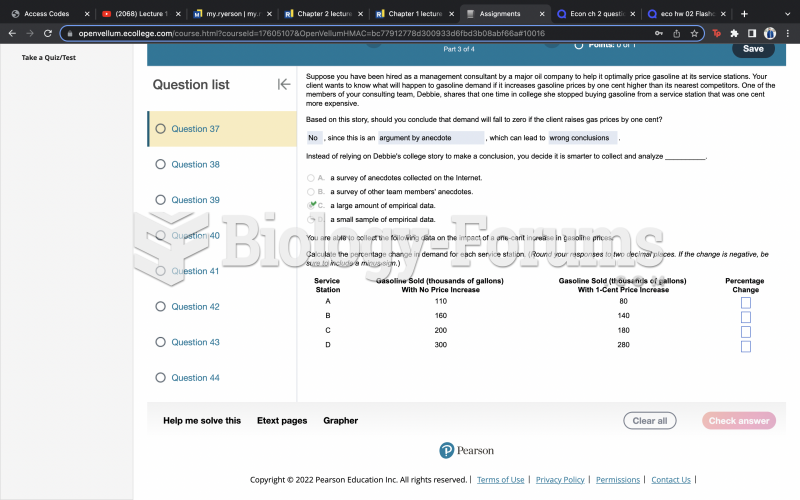 Economics question
 economic question (having trouble)