This topic contains a solution. Click here to go to the answer
|
|
|

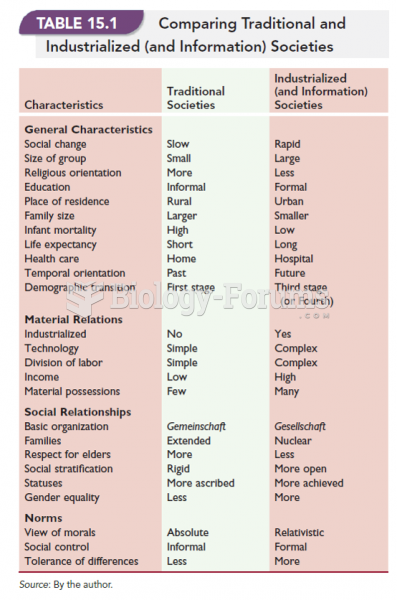 Comparing Traditional and Industrialized (and Information) Societies
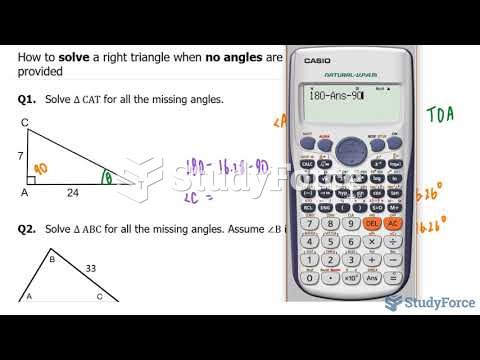 How to solve a right triangle when no angles are provided
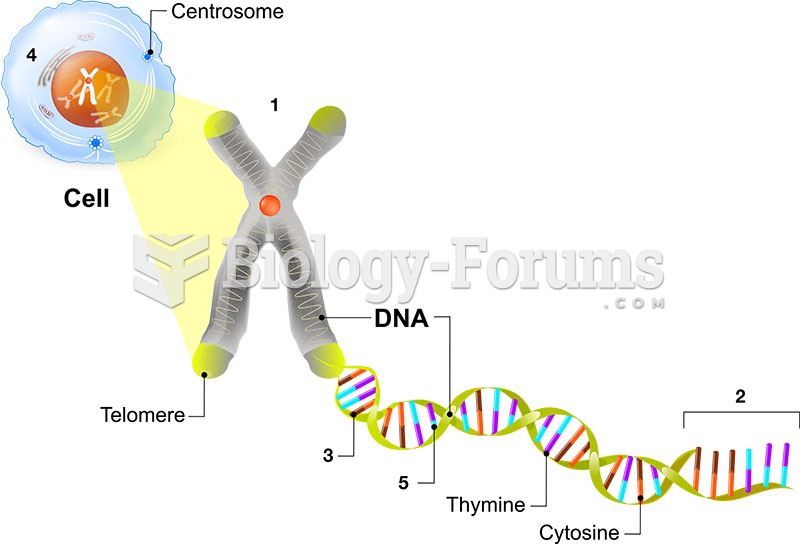 Molecular Genetic Matching question
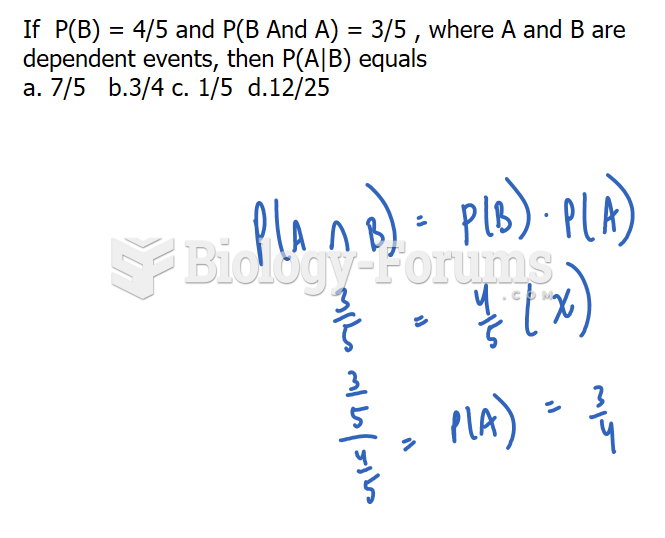 Probability Question
 economic question
 Hi i really need help clarifying this question T^T