This topic contains a solution. Click here to go to the answer
|
|
|

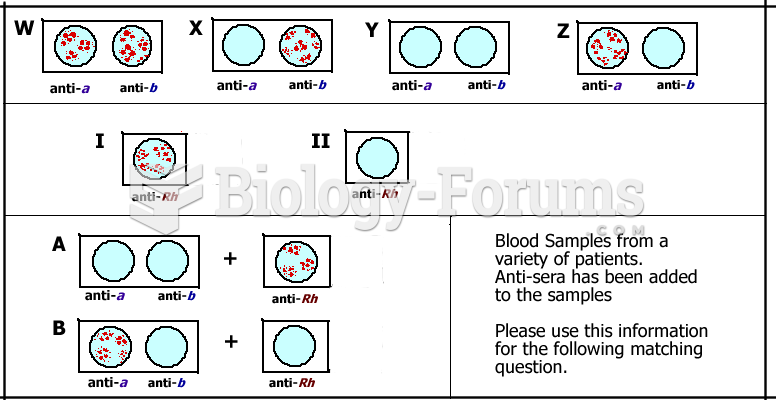 Question
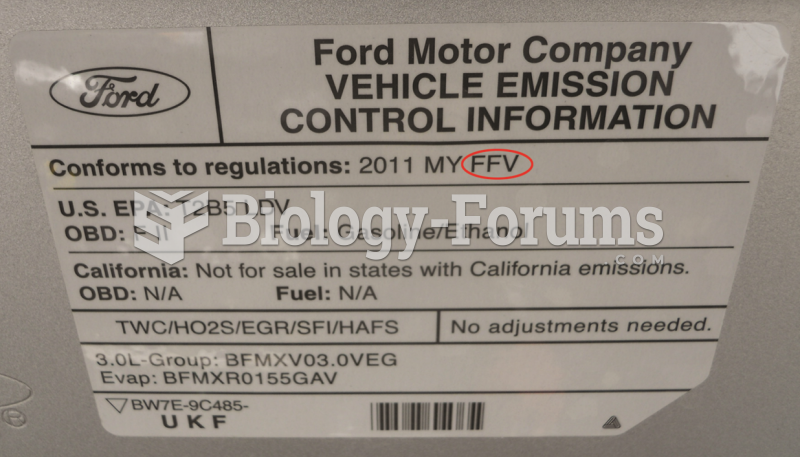 A vehicle emission control information (VECI) sticker on a flexible fuel vehicle.
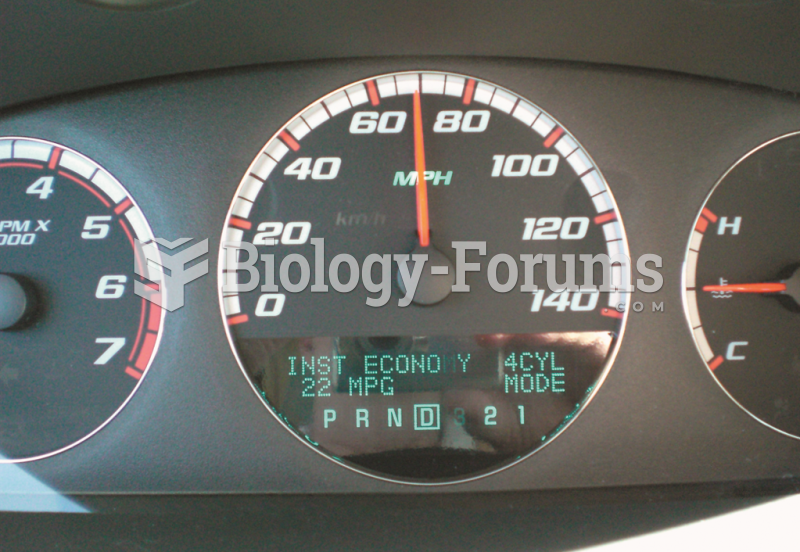 The driver information display on a Chevrolet Impala with a 5.3 liter V-8 equipped with active fuel ...
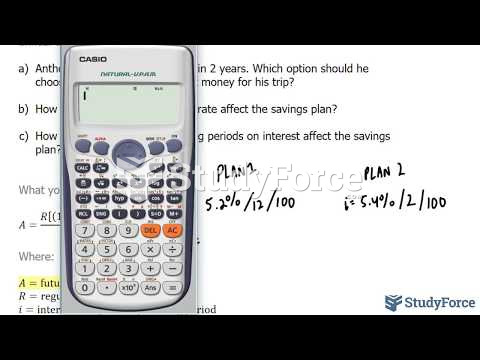 How to choose the right payment plan with changing conditions (Question 1)
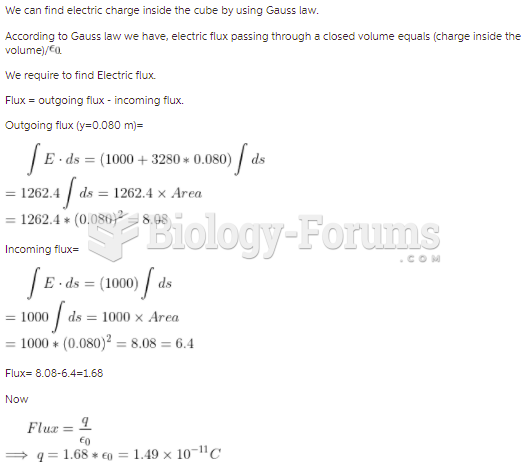 The cube of insulating material shown in the figure has one corner at the origin. Each side of ...
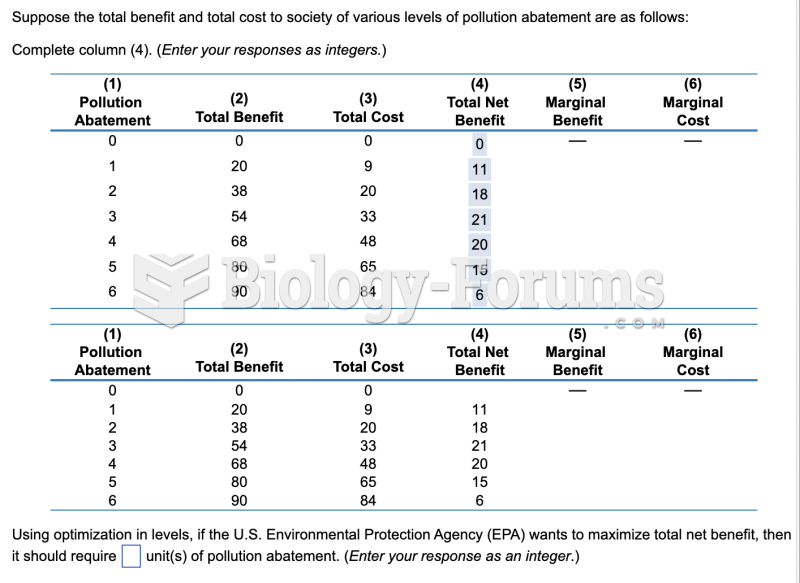 economic question