This topic contains a solution. Click here to go to the answer
|
|
|

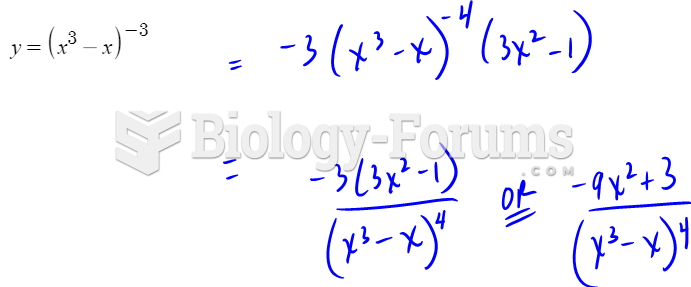 Find the derivative by using the chain rule, question 2
 Answer
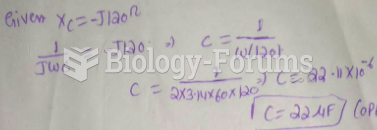 If the frequency equals 60 Hz in Figure 10-1, what is the value of capacitance?
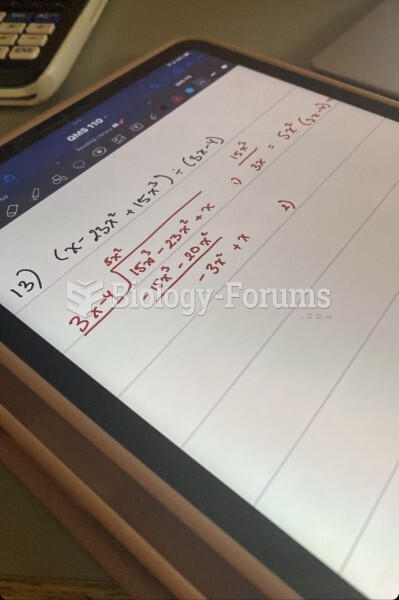
 Economics question
 Economics question
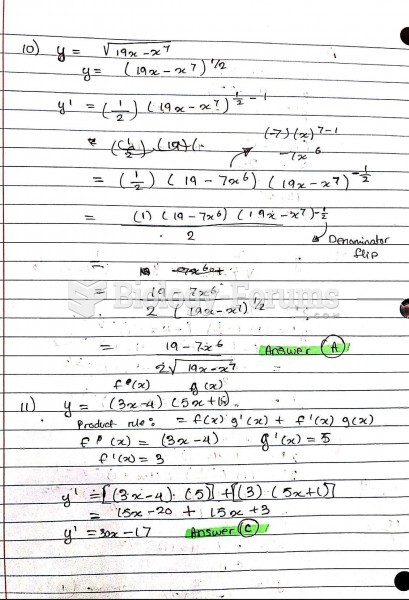
 Help with this quick question please