This topic contains a solution. Click here to go to the answer
|
|
|

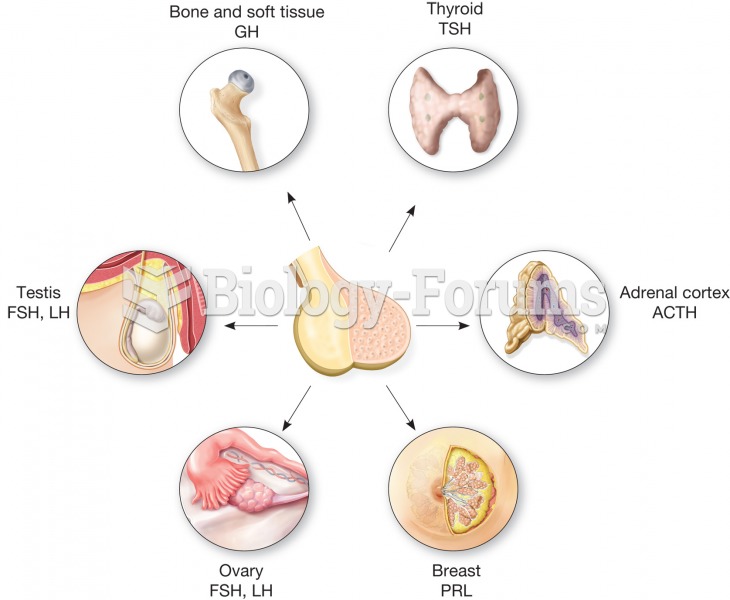 The anterior pituitary is sometimes called the master gland because it secretes many hormones that r
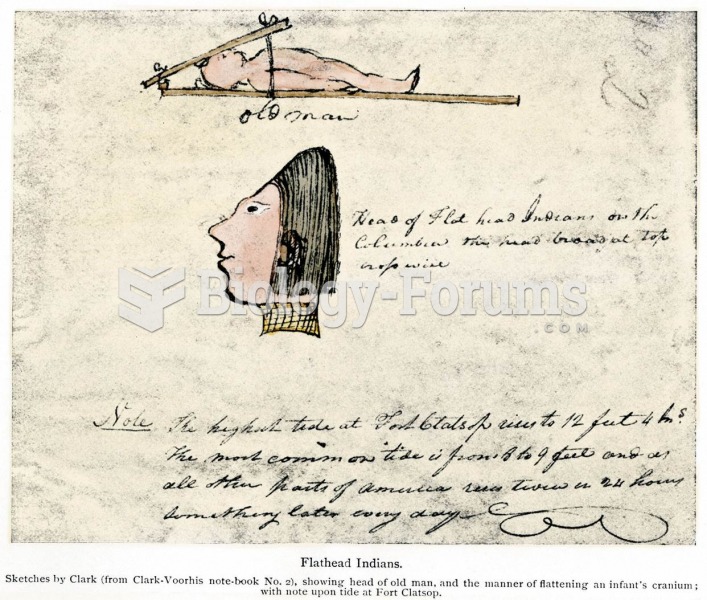 The “Flat Head” (Chinook) Indians acquired their name through shaping in infancy, as shown in a diag
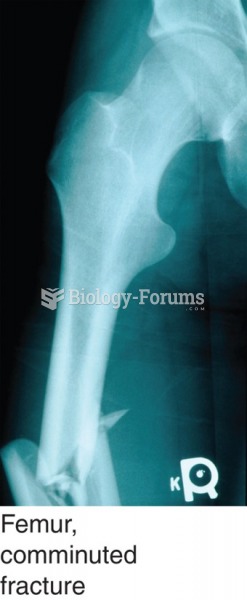 Fractures are diagnosed based on an X-ray of the broken bone. Shown here: a comminuted fracture of ...
 Figure and Ground
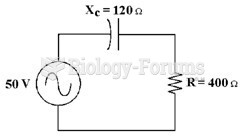 If the frequency equals 60 Hz in Figure 10-1, what is the value of capacitance?
 Meiosis is used to make sperm and egg cells. A shows a simplified version and B shows a detailed ver