This topic contains a solution. Click here to go to the answer
|
|
|

 The Red-bearded Bee-eater Nyctyornis amictus is a large species of bee-eater found in the Indo-Malay
 Working and Living and Playing in the City Dump of Phnom Penh, Cambodia
 The large intestine.
 Move joints in hands. Apply scissoring to metacarpals and figure-8s to fingers.
 Statuette of a Male Figure
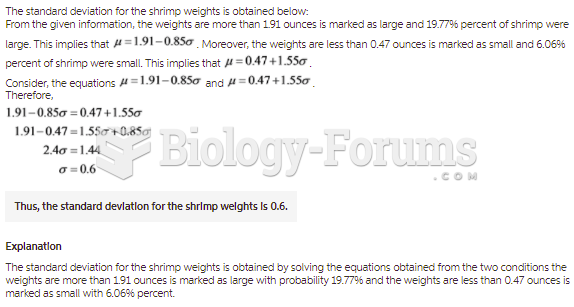 The Globe Fishery packs shrimp that weigh more than 1.91 ounces each in packages marked large ...