This topic contains a solution. Click here to go to the answer
|
|
|

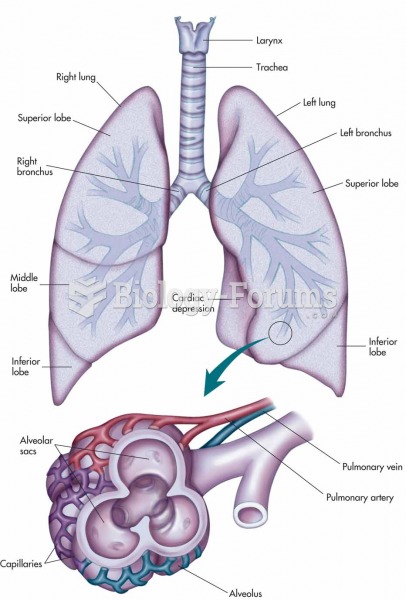 Larynx, trachea, bronchi, and lungs with an expanded view showing the structures of an alveolus and
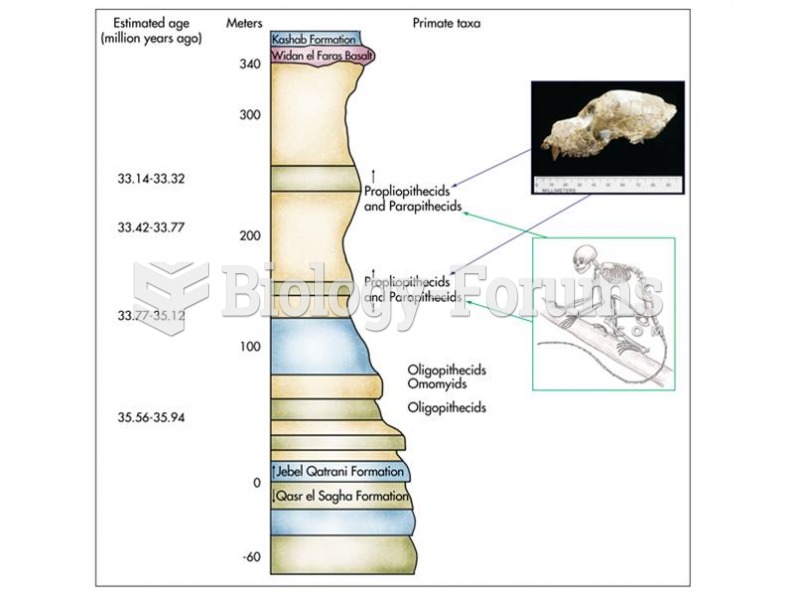 Stratigraphic section of the Fayum shows the relative age of early anthropoid fossils.
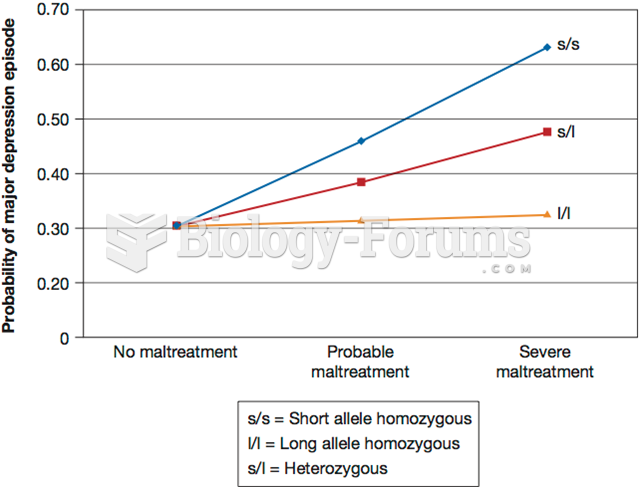 Probability of Major Depression as a Function of 5-HTT Allele and Levels of Maltreatment ...
 The posted octane rating in most high-altitude areas shows regular at 85 instead of the usual 87.
 How to plot a cosine function containing an amplitude and phase-shift (Question 2 of 2)
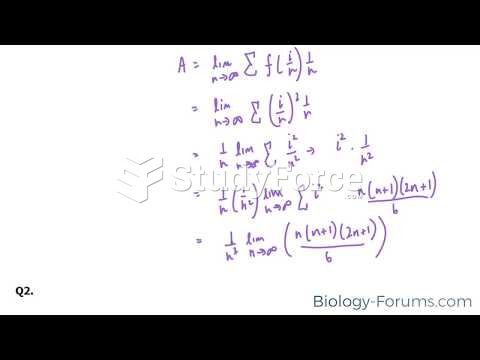 How to find the area of a function using limits and Riemann sums