This topic contains a solution. Click here to go to the answer
|
|
|

 When using an interpreter, the nurse should pose questions directly to the patient, not the interpre
 This lithograph of the New York draft riots, 1863, shows that although the rioters mainly targeted b
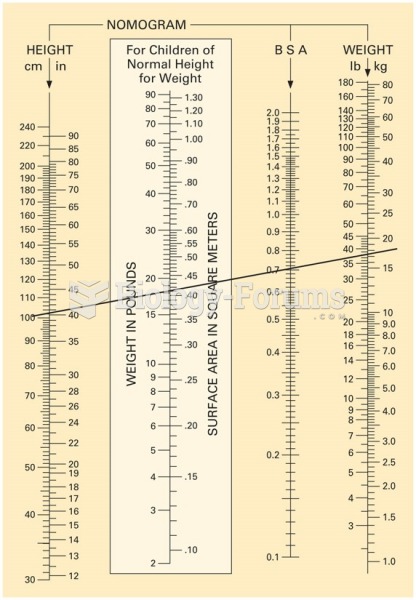 Nomogram chart. This example shows a line drawn from a child’s height of 100 cm to his weight, 35 ...
 Answer to Vector Question Pt. 1
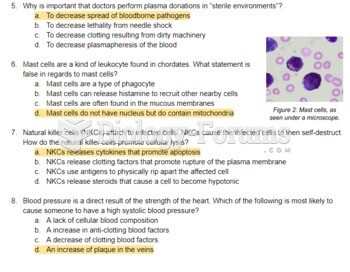 bio questions
 I NEED IT FOR TODAY PLEASE 14 QUESTIONS