This topic contains a solution. Click here to go to the answer
|
|
|

 Answer
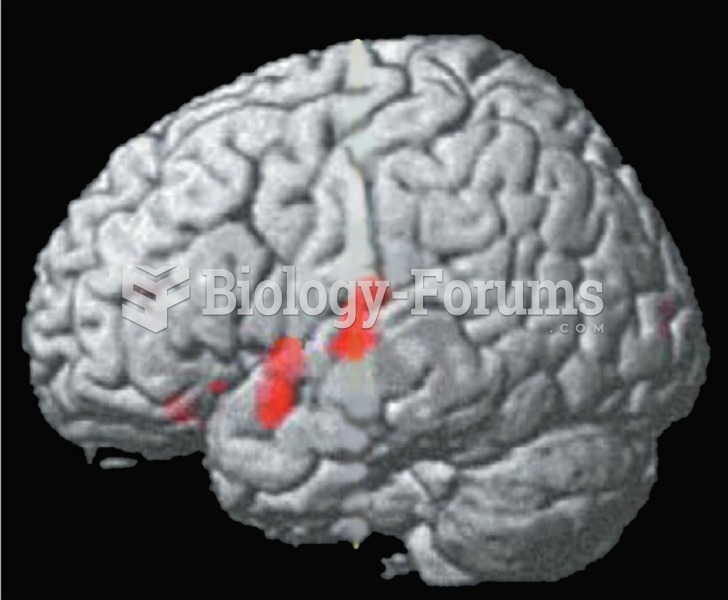 Effects of Therapy for Stuttering A functional MRI scan shows regions of the superior temporal lobe
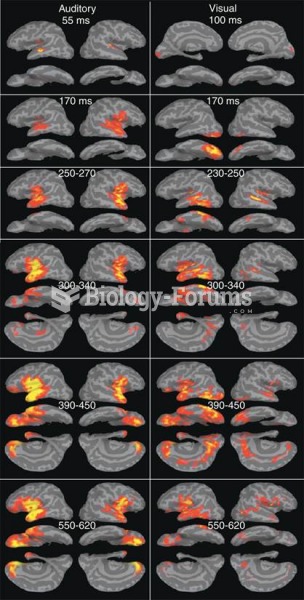 Hearing and Reading Words
 Set the meter to read ohms (V) and measure the resistance of the relay coil. The usual reading for ...
 Increased neurogenesis in the dentate gyrus following damage. The left panel shows (1) an ...
 History Questions