Question 1
An x-bar control chart was examined and no data points fell outside of the limits. Can this process be considered in control?
◦ No, the number of samples must be known.
◦ Yes.
◦ Yes, there is not enough data to determine otherwise.
◦ No, there could be a pattern to the points, the R-chart must be checked.
◦ Yes, it is unlikely that there is a pattern in these points.
Question 2
Statistical process control charts
◦ display the measurements on every item being produced.
◦ display upper and lower limits for process variables or attributes, and signal when a process is no longer in control.
◦ indicate to the process operator the average outgoing quality of each lot.
◦ display the measurements on every item being purchased.
◦ indicate to the operator the true quality of material leaving the process.

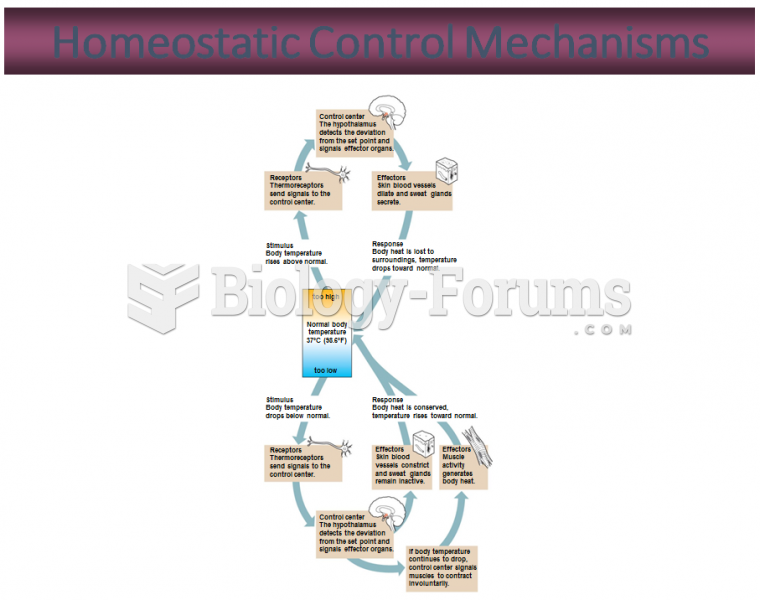 Homeostatic Control Mechanisms
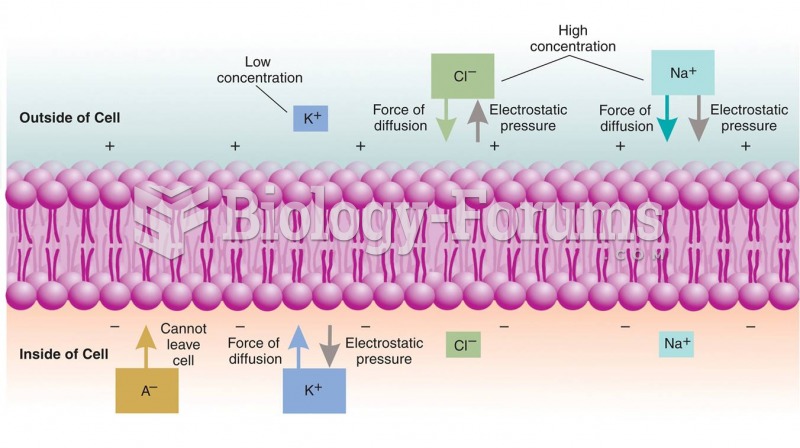 Control of the Membrane Potential
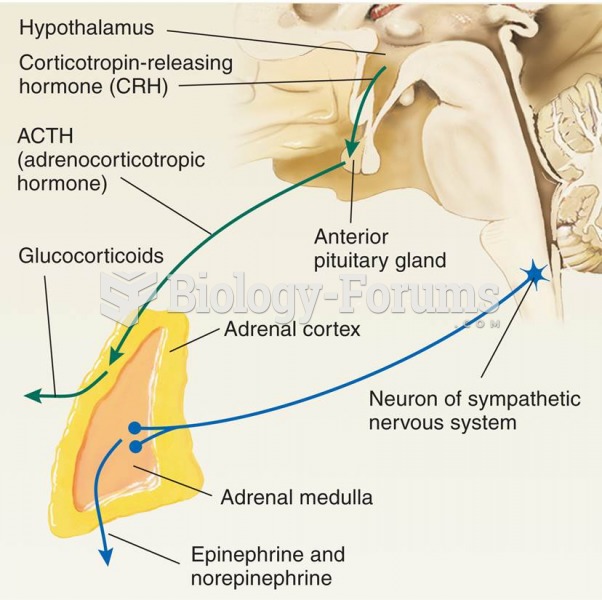 Control of Secretion of Stress Hormones
 Margaret Sanger, birth control pioneer.
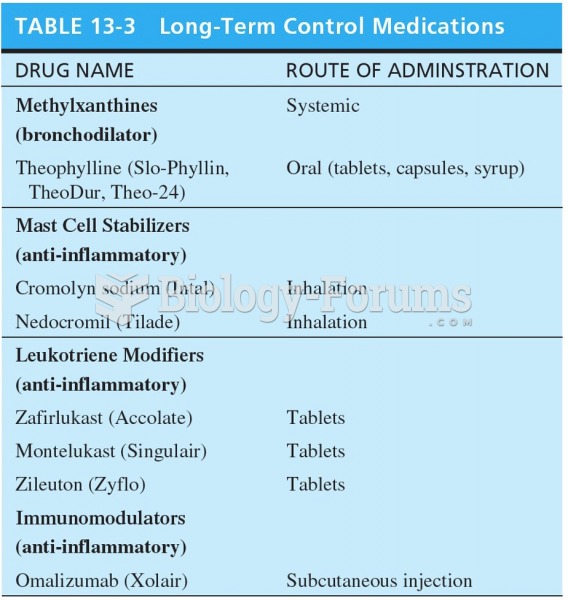 Long Term Control Medications
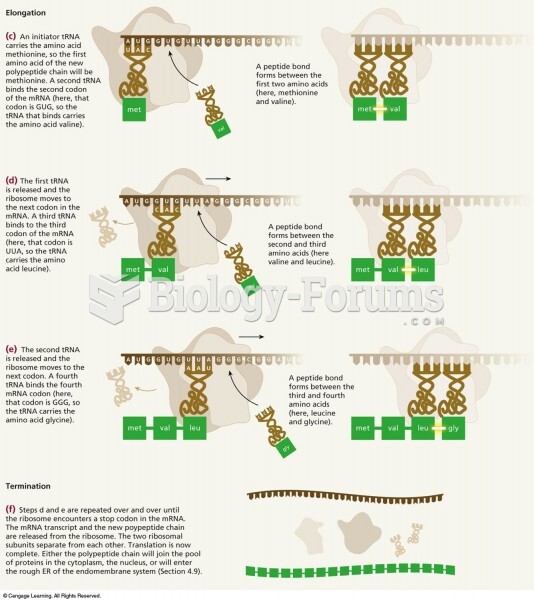 Steps in the process of translation (Part 2)