|
|
|
The top 10 most important tips that will help you grow old gracefully include (1) quit smoking, (2) keep your weight down, (3) take supplements, (4) skip a meal each day or fast 1 day per week, (5) get a pet, (6) get medical help for chronic pain, (7) walk regularly, (8) reduce arguments, (9) put live plants in your living space, and (10) do some weight training.
The average human gut is home to perhaps 500 to 1,000 different species of bacteria.
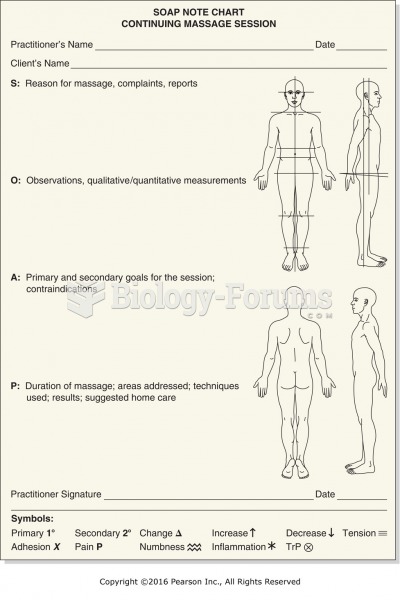
All adverse reactions are commonly charted in red ink in the patient's record and usually are noted on the front of the chart. Failure to follow correct documentation procedures may result in malpractice lawsuits.
The calories found in one piece of cherry cheesecake could light a 60-watt light bulb for 1.5 hours.
Although the Roman numeral for the number 4 has always been taught to have been "IV," according to historians, the ancient Romans probably used "IIII" most of the time. This is partially backed up by the fact that early grandfather clocks displayed IIII for the number 4 instead of IV. Early clockmakers apparently thought that the IIII balanced out the VIII (used for the number 8) on the clock face and that it just looked better.


