This topic contains a solution. Click here to go to the answer
|
|
|

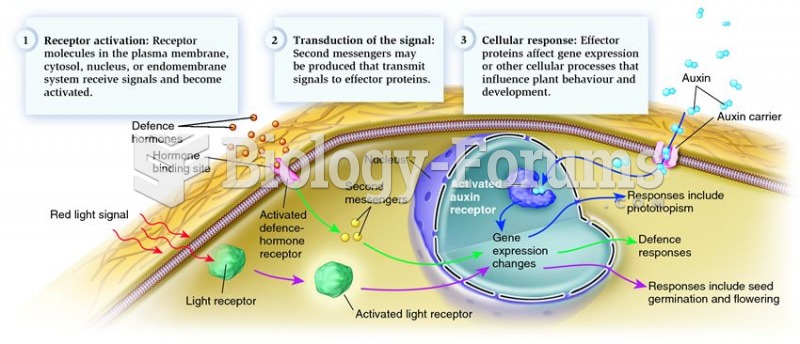 An overview of plant signal transduction.
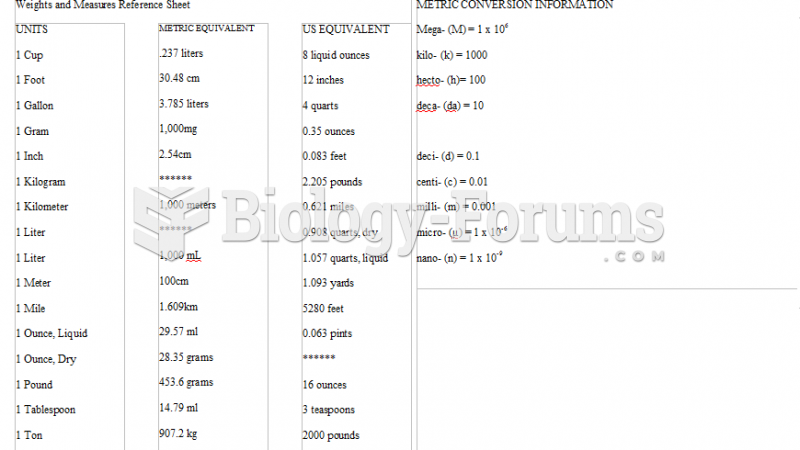 Conversion Chart
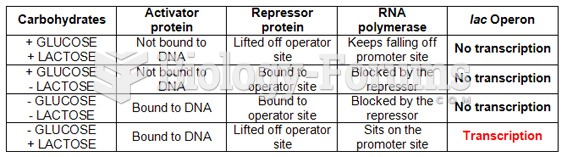 Lactose Operon Summary Chart
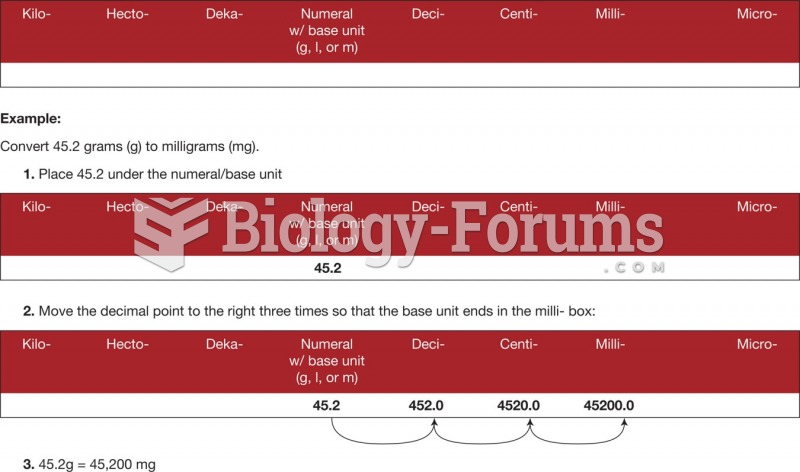 Metric conversion using the place value chart.
 A typical waveform from a knock sensor during a spark knock event. This signal is sent to the ...
 Bio Chart