This topic contains a solution. Click here to go to the answer
|
|
|

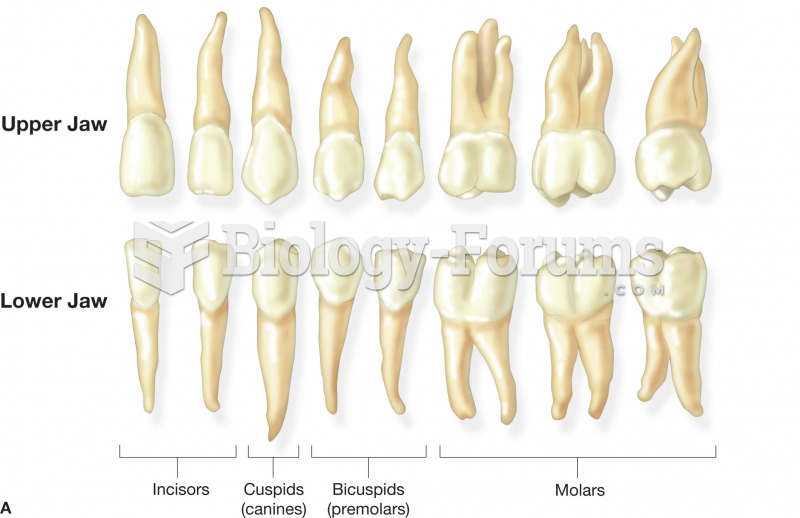 (A) The name and shape of the adult teeth. These teeth represent those found in the right side of th
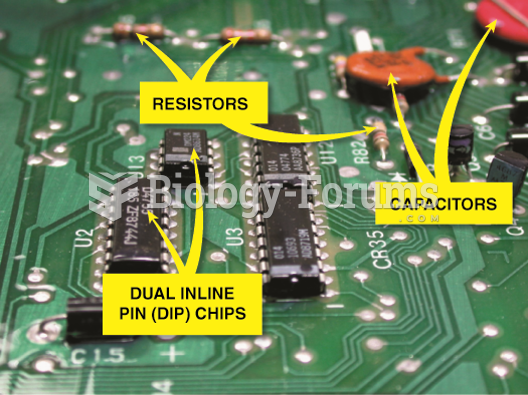 Many electronic components are used to construct a typical vehicle computer. Notice the quantity of ...
 Positive velocity graph
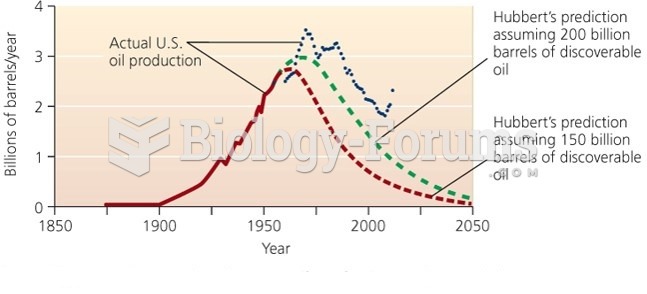 Hubbard’s Predication of Peak in U.S Oil Production with Actual Data
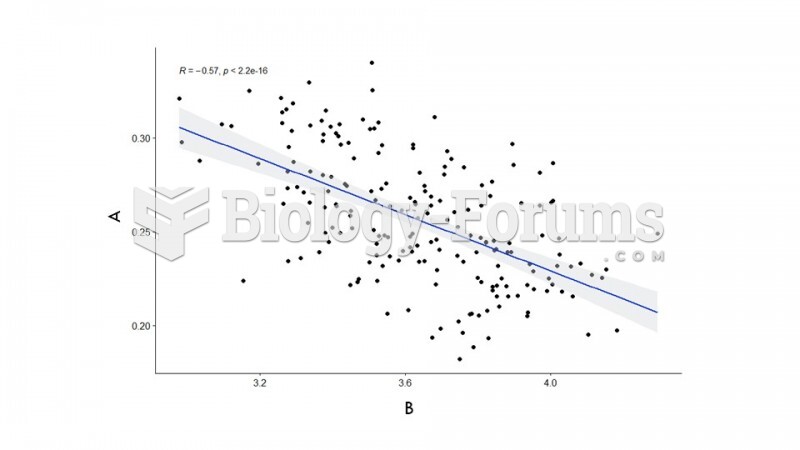 graph
graph
 A hypothetical grid of data used in synteny testing