This topic contains a solution. Click here to go to the answer
|
|
|

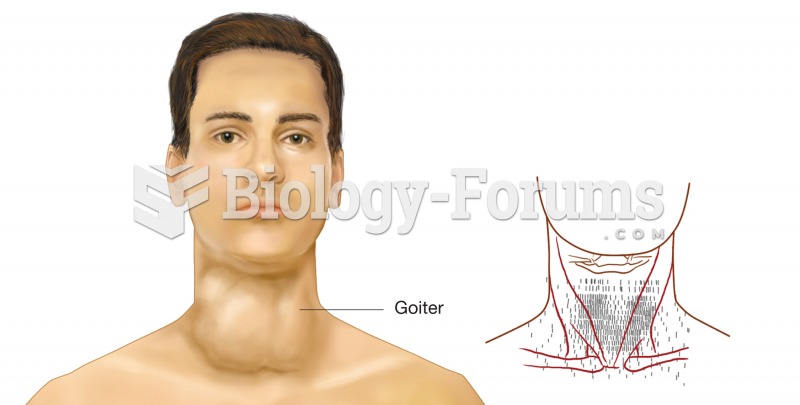 Thyroid scan. The right image is the data from a thyroid scan, printed on a superimposed map of the
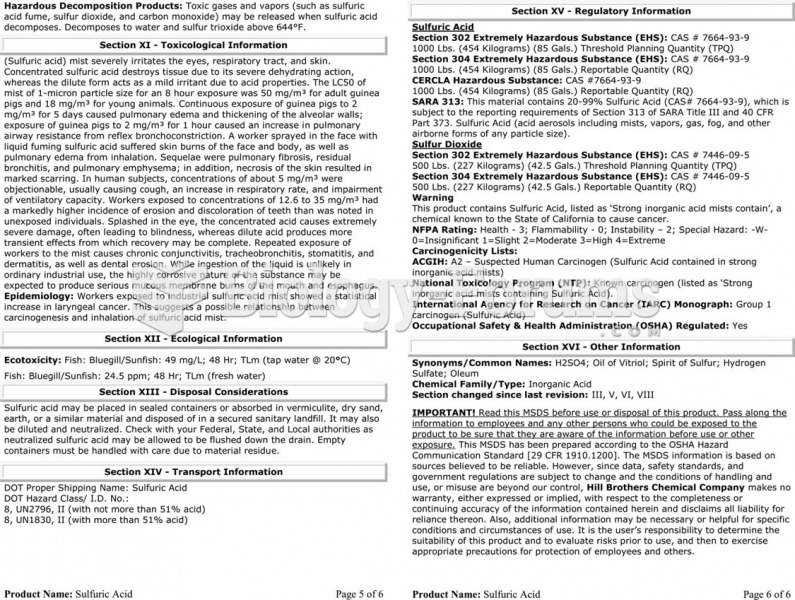 The material safety data sheet (MSDS) for sulfuric acid showing the detailed technical information ...
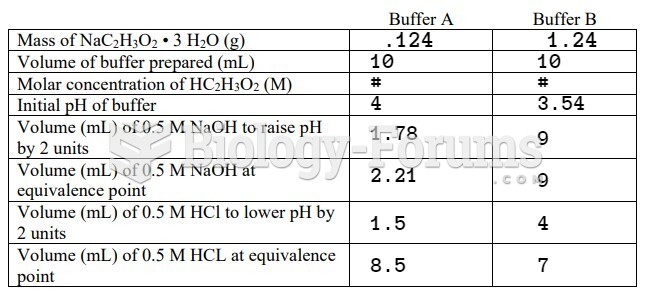
 How to create a frequency table and histogram from raw data
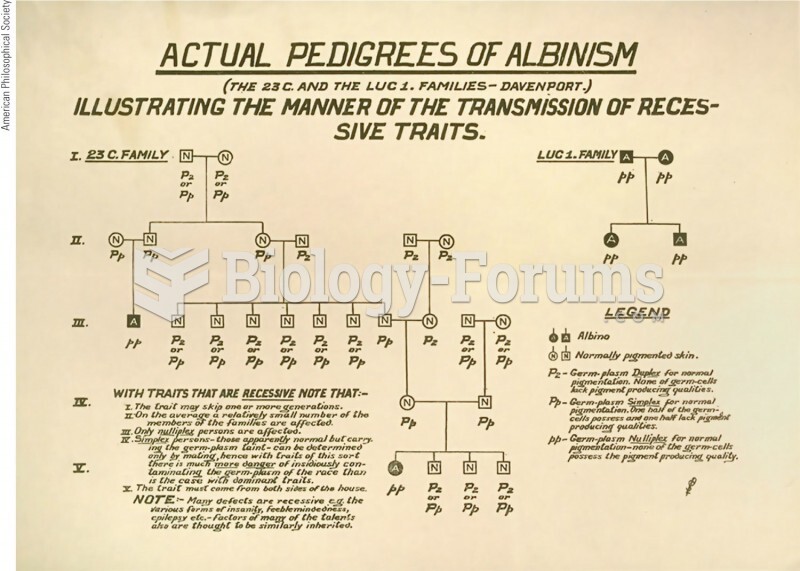 A pedigree for albinism collected in the early years of the twentieth century by Charles Davenport,
 data
data
 data
data