This topic contains a solution. Click here to go to the answer
|
|
|

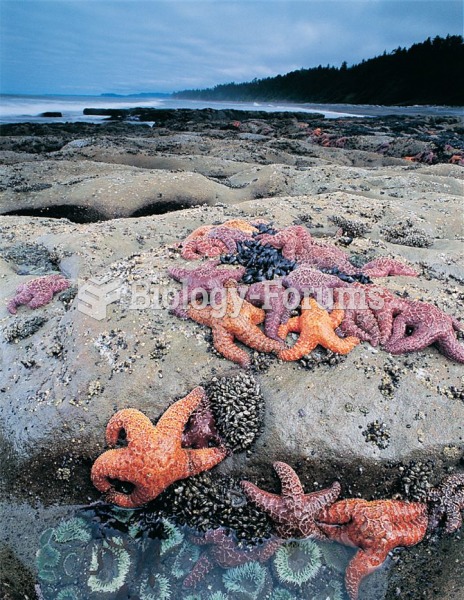 A rocky shore at low tide, showing the great abundance that can be attained by populations of intert
 Selected Nonsteroidal Anti-Inflammatory Drugs
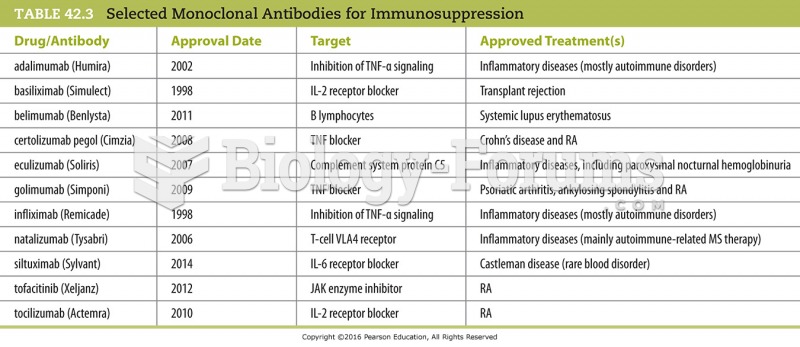 Selected Monoclonal Antibodies for Immunosuppression
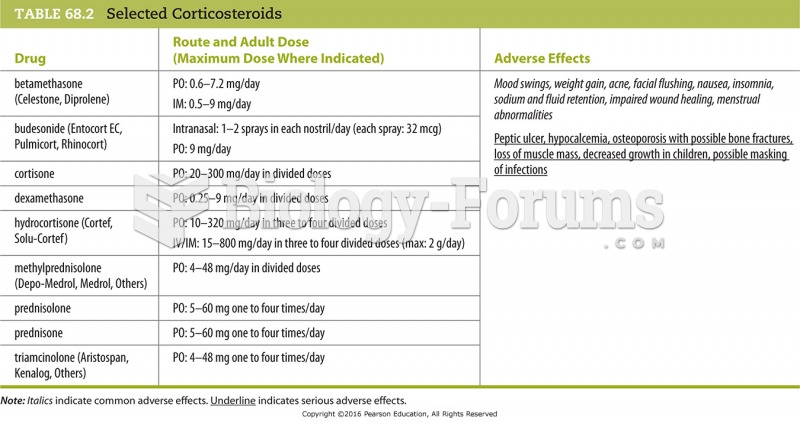 Selected Corticosteroids
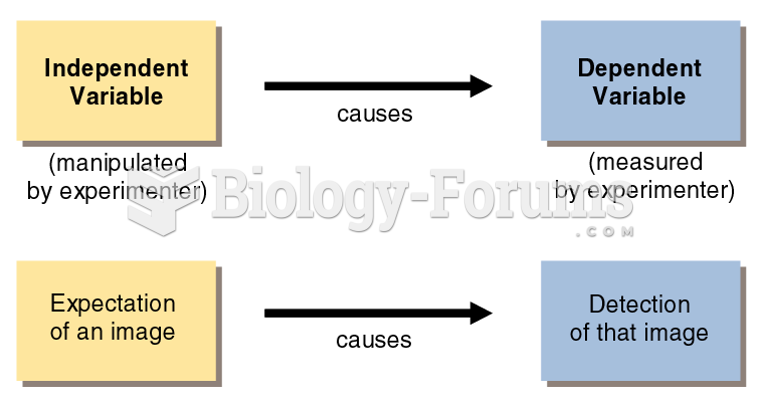 Independent and Dependent Variables
 Properties of Selected Bacterial, Eukaryotic, and Archaeal DNA Polymerases