This topic contains a solution. Click here to go to the answer
|
|
|

 Blank periodic table
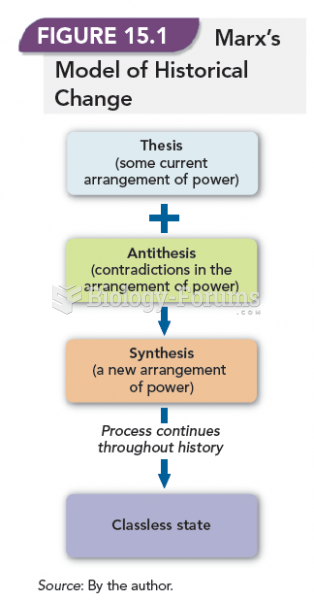 Marx's Model of Historical Change
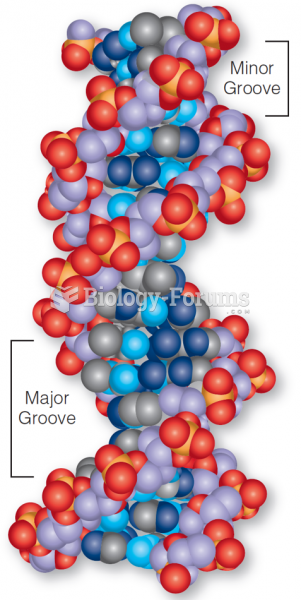 A space-filling model of DNA.
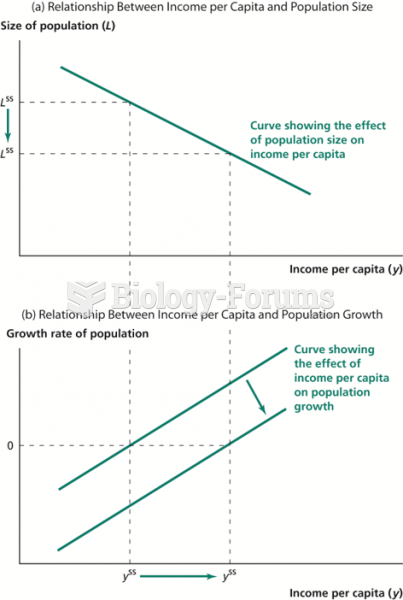 Effect of “Moral Restraint” in the Malthusian Model
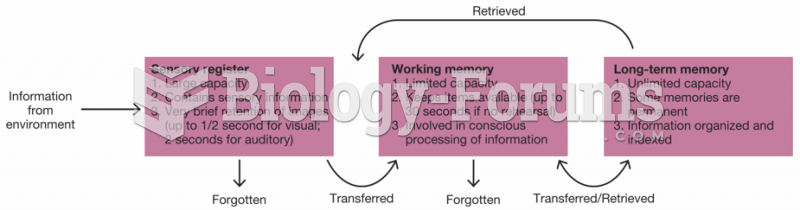 Three-Box Model
 Gamete genotype frequencies calculated from genetic linkage data