This topic contains a solution. Click here to go to the answer
|
|
|

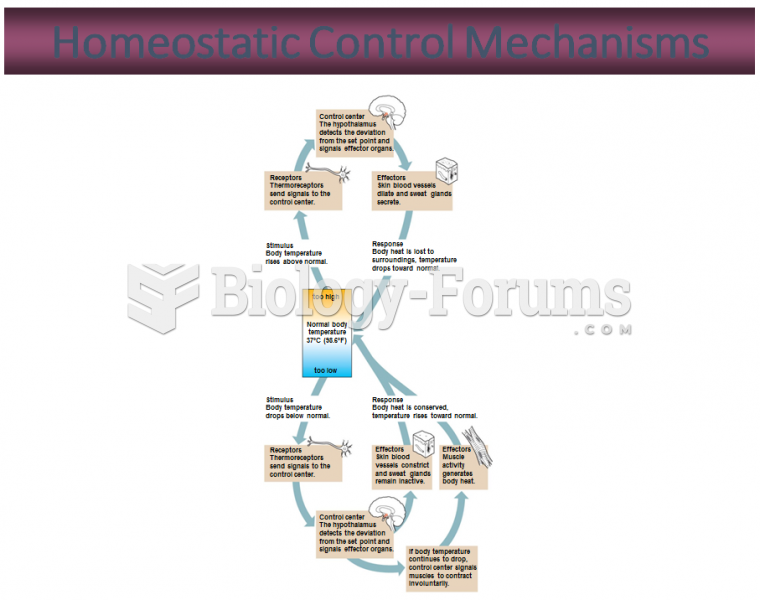 Homeostatic Control Mechanisms
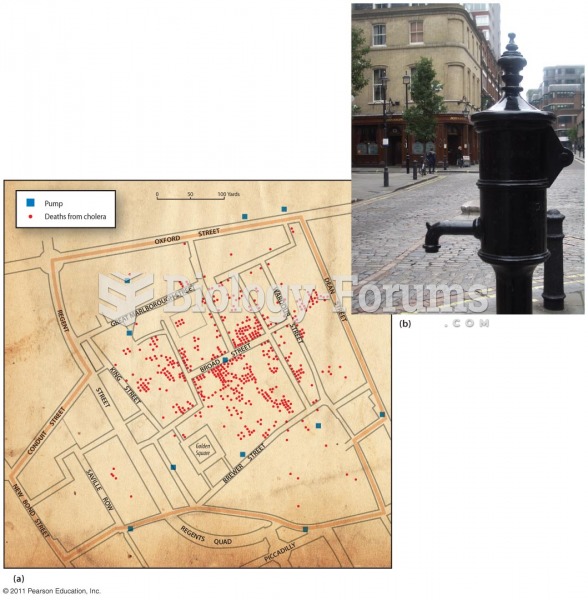 Tracing the Source of a Water-Borne Disease
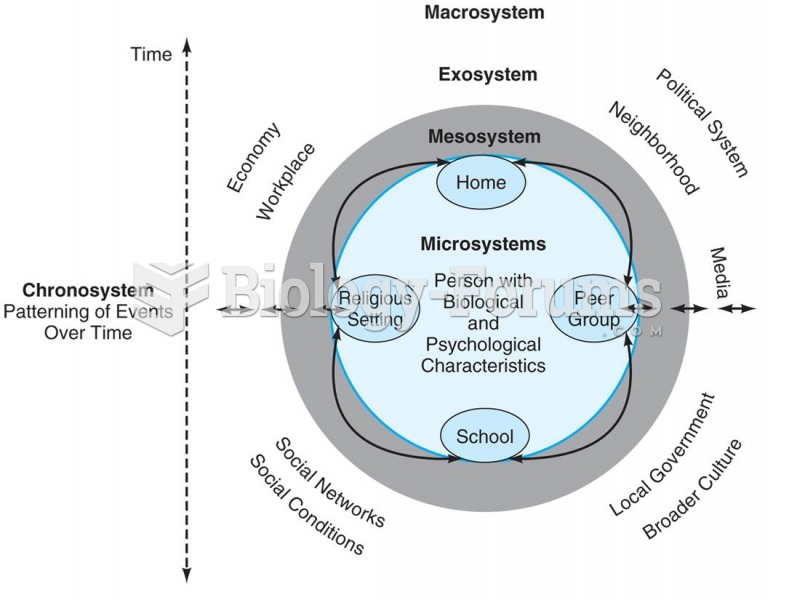 Bronfenbrenner’s model of the ecological-systems approach to studying development. He suggested that
 Macaroni and cheese provides a double source of riboflavin from the pasta and the cheese
 Detecting a deletion in the CFTR gene by ASO testing
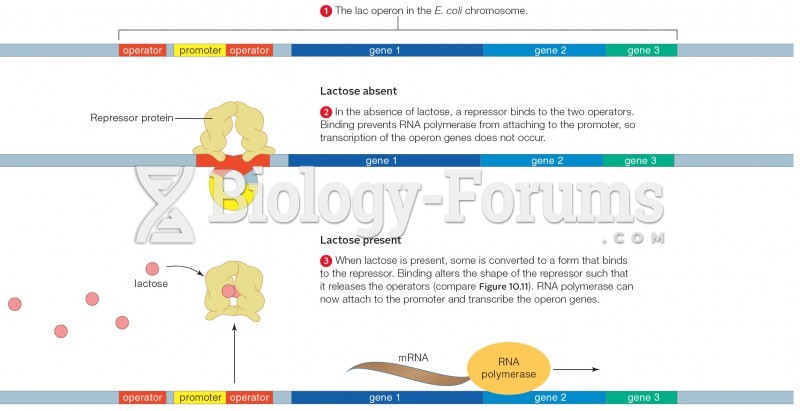 Example of gene control in bacteria