This topic contains a solution. Click here to go to the answer
|
|
|

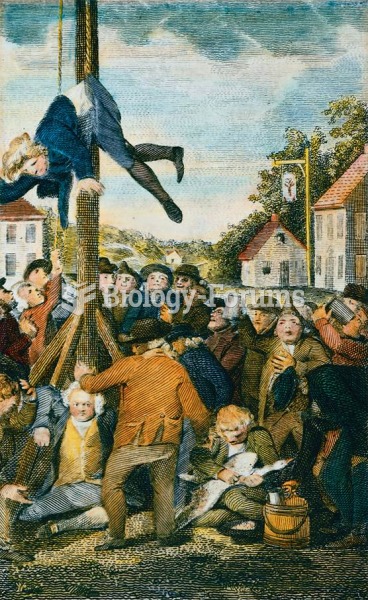 This 1795 engraving of a Stamp Act protest delineates a class division. The three British Tories—one
 Work Settings for People Earning Master’s and Bachelor’s Degrees in Psychology
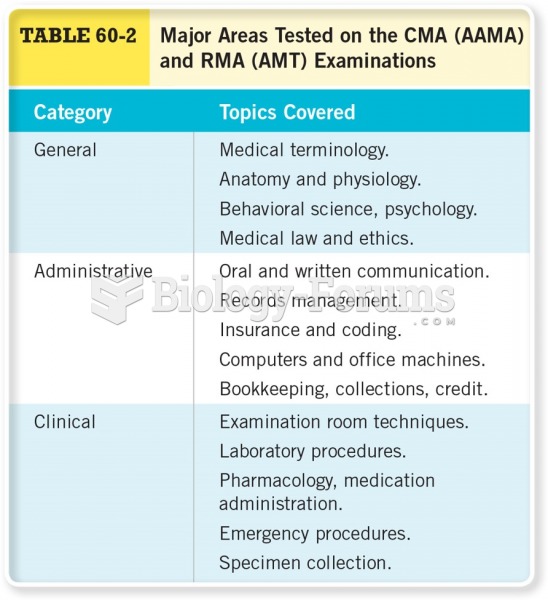 Major Areas Tested on the CMA and RMA Examinations
 Social class and social status
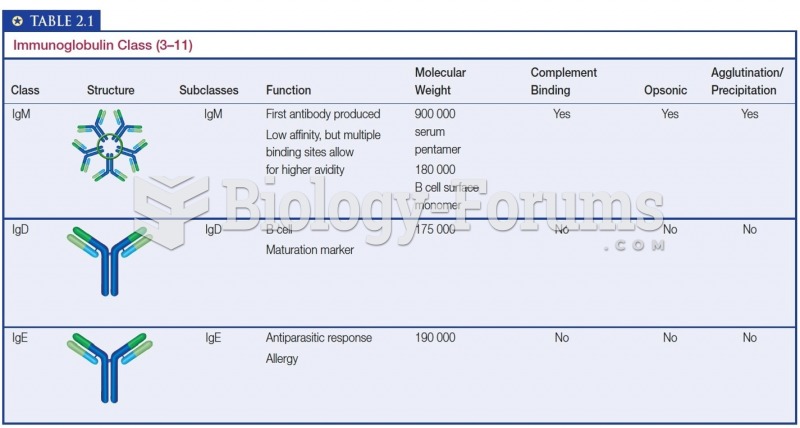 Immunoglobulin Class (3–11)
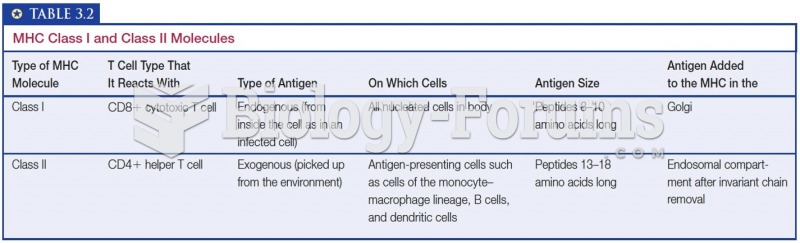 MHC Class I and Class II Molecules