This topic contains a solution. Click here to go to the answer
|
|
|

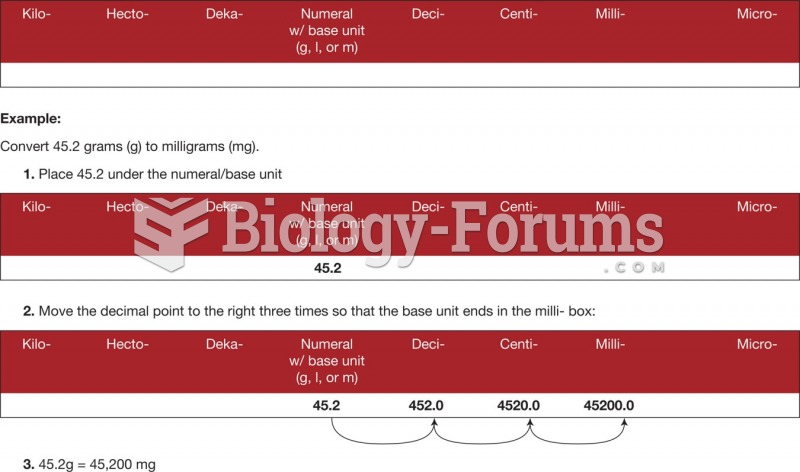 Metric conversion using the place value chart.
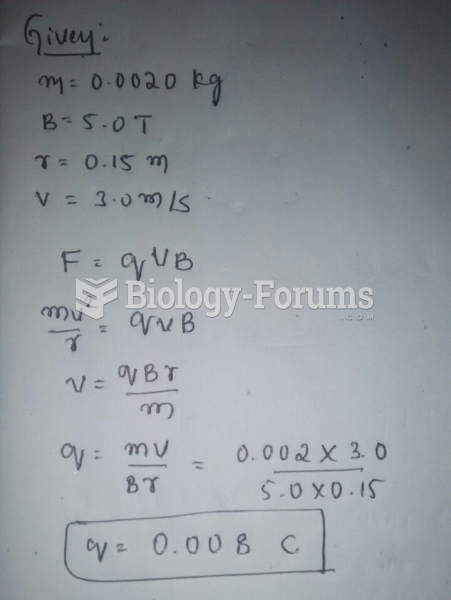 If the particle moves in a circle of radius 0.15 m at a speed of 3.0 m/s, what is the magnitude ...
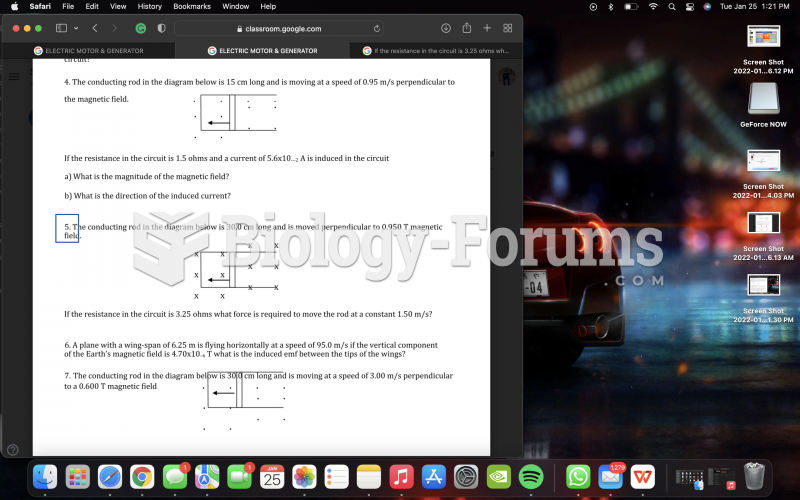 physics question number 5 - moving conductors
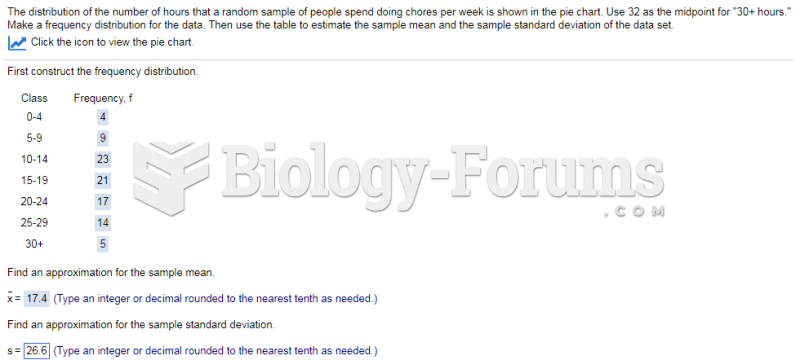 The distribution of the number of hours that a random sample of people spend doing chores per ...
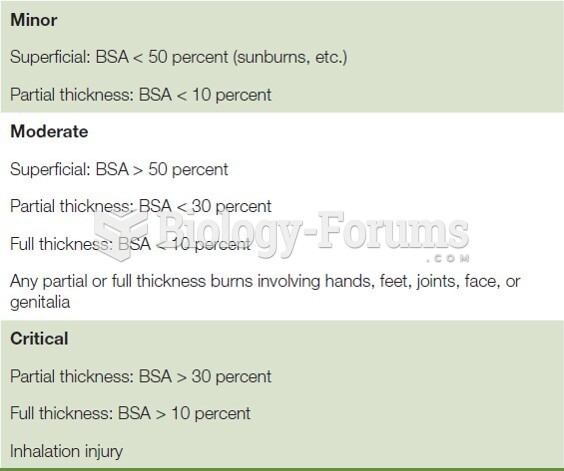 Burn Severity Chart
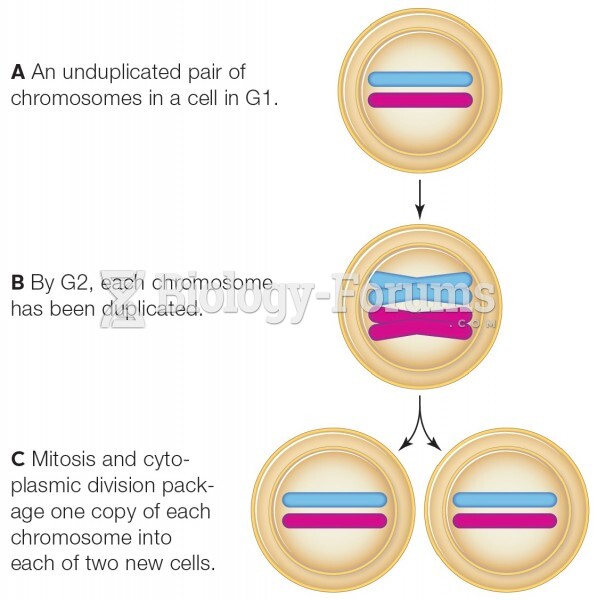 How mitosis maintains the chromosome number.