This topic contains a solution. Click here to go to the answer
|
|
|

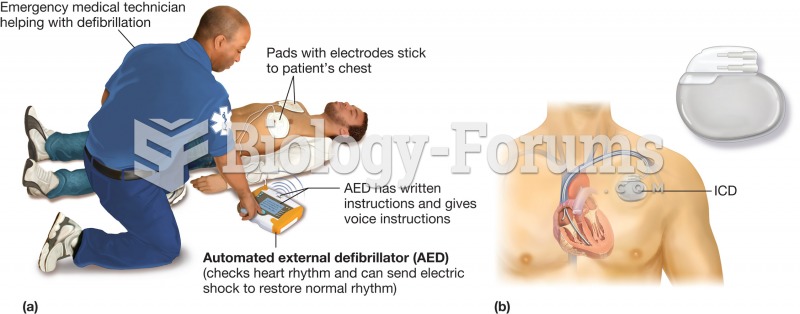 Defibrillator. Defibrillators are devices that supply a voltage charge to the heart in the hope of r
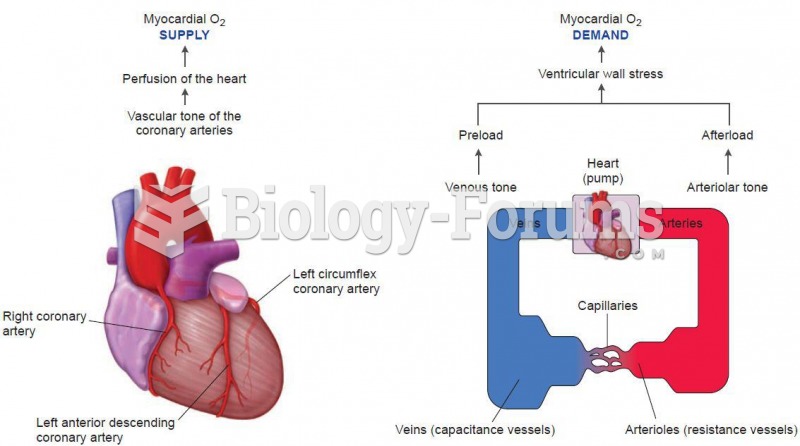 Myocardial Oxygen supply and demand
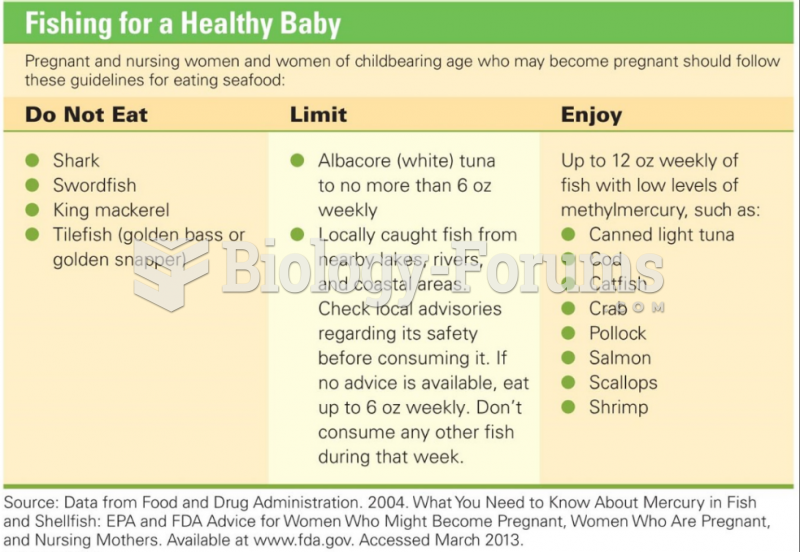 Fishing for a Healthy Baby
 Testing the arterial supply to the lower extremities
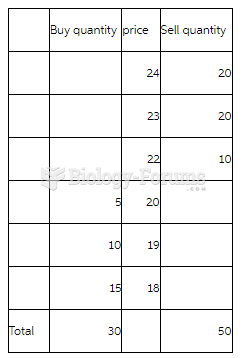 Markets and Institutions Market Story Problem
 Jia's Fashions recently paid a $2 annual dividend. The company is projecting that its ...